


What is the most effective stop-loss strategy?
Choosing the Best Stop-Loss Strategy for Your Investments Stop-loss is a risk management tool widely used by traders and investors to limit potential …
Read Article
The Moving Average Convergence Divergence (MACD) is a widely used technical indicator in the world of trading. It was developed by Gerald Appel in the late 1970s and has since become a staple tool for many professional traders.
One of the reasons why MACD is so popular among professionals is its ability to identify and confirm trends in the market. The indicator consists of two lines - the MACD line and the signal line - which are calculated using moving averages of different time periods. When the MACD line crosses above the signal line, it is seen as a bullish signal, indicating that the price of the asset may continue to rise. On the other hand, when the MACD line crosses below the signal line, it is seen as a bearish signal, indicating that the price may continue to fall.
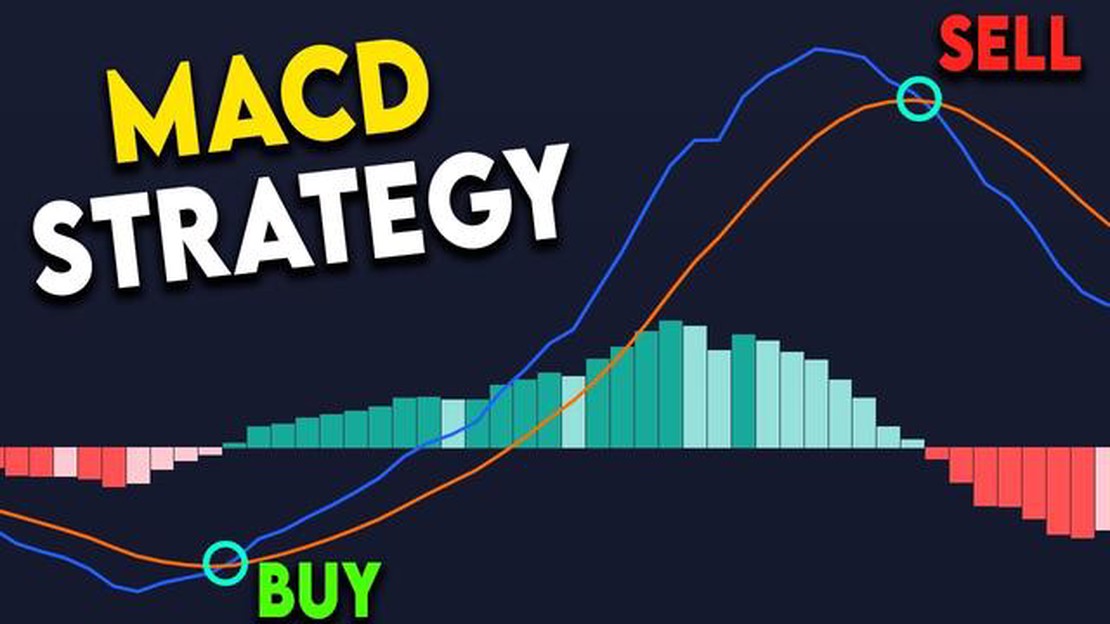
Another reason why professional traders use MACD is its ability to generate buy and sell signals. When the MACD line crosses above the signal line, it is considered a buy signal, suggesting that it may be a good time to enter a long position. Conversely, when the MACD line crosses below the signal line, it is considered a sell signal, indicating that it may be a good time to exit a long position or even enter a short position.
In addition to trend identification and generating buy and sell signals, MACD can also be used to identify divergences, which occur when the price of an asset is moving in the opposite direction of the indicator. This can be a sign that the current trend may be losing momentum and a reversal may be imminent.
Overall, MACD is a versatile and powerful tool that is widely used by professional traders for its ability to identify trends, generate buy and sell signals, and identify potential reversals. While it is not a foolproof indicator and should be used in conjunction with other tools and analysis, it is definitely a valuable tool to have in one’s trading arsenal.
In conclusion, MACD is indeed widely used by professional traders due to its effectiveness in analyzing market trends, generating signals, and identifying potential reversals. Whether you are a beginner or an experienced trader, incorporating MACD into your trading strategy can help improve your decision-making process and increase your chances of making profitable trades.
The MACD line is calculated by subtracting the 26-day Exponential Moving Average (EMA) from the 12-day EMA. The resulting line fluctuates above and below the zero line, representing bullish and bearish market conditions, respectively. When the MACD line crosses above the zero line, it generates a buy signal, indicating a potential trend reversal to the upside. Conversely, when the MACD line crosses below the zero line, it generates a sell signal, indicating a potential trend reversal to the downside.

The signal line, which is a 9-day EMA of the MACD line, is plotted on top of the MACD line to generate additional trading signals. When the MACD line crosses above the signal line, it generates a bullish signal, suggesting a potential buying opportunity. Conversely, when the MACD line crosses below the signal line, it generates a bearish signal, suggesting a potential selling opportunity.
The histogram, which is derived from the difference between the MACD line and the signal line, provides visual representation of the strength of a market trend. When the histogram bars are above the zero line, it indicates upward momentum, and when the bars are below the zero line, it indicates downward momentum.
The MACD is widely used by professional traders due to its simplicity and effectiveness in identifying trend reversals and generating trading signals. However, it should be used in conjunction with other technical analysis tools and indicators to increase the probability of successful trades.
| Advantages | Disadvantages |
|---|---|
| - Easy to interpret and understand | - Lagging indicator, may generate late signals |
| - Provides clear buy/sell signals | - False signals may occur in sideways markets |
| - Can be used on different timeframes | - Not suitable for all market conditions |
| - Effective in trending markets | - May produce whipsaw signals in choppy markets |
Read Also: Can I Trade Forex with $100 Dollars? Learn How to Start Trading on a Budget
The Moving Average Convergence Divergence (MACD) is a widely used technical indicator in the field of technical analysis. It is a momentum indicator that helps traders identify potential buy and sell signals in financial markets.
The MACD consists of two lines, the MACD line and the signal line, as well as a histogram. The MACD line is calculated by subtracting the 26-day exponential moving average (EMA) from the 12-day EMA. The signal line is typically a 9-day EMA of the MACD line. The histogram represents the difference between the MACD line and the signal line.
Read Also: Discover the Impressive Awards Earned by Moneta Markets
The MACD is commonly used to generate trading signals. When the MACD line crosses above the signal line, it is considered a bullish signal, indicating a potential buy opportunity. Conversely, when the MACD line crosses below the signal line, it is considered a bearish signal, indicating a potential sell opportunity.
In addition to generating buy and sell signals, the MACD can provide valuable insights into the strength of market trends. When the MACD line and the signal line diverge, it suggests that the current trend may be losing momentum. Conversely, when the MACD line and the signal line converge, it indicates that the current trend may be gaining momentum.
Furthermore, the MACD can be used to identify potential trend reversals. When the MACD line and the signal line change direction, it can indicate a shift in the market sentiment. For example, when the MACD line crosses above the signal line and both lines start moving upward, it suggests a potential trend reversal from bearish to bullish.
| Advantages of MACD in Technical Analysis | Limitations of MACD in Technical Analysis |
|---|---|
| - Easy to understand and implement | - Lagging indicator that may generate late signals |
| - Provides buy and sell signals | - May generate false signals in choppy or sideways markets |
| - Helps identify market trends and reversals | - Relies on moving averages, which may not work well in volatile markets |
| - Can be used in conjunction with other technical indicators | - Should not be used as the sole basis for trading decisions |

In conclusion, the MACD is a significant tool in technical analysis due to its ability to generate buy and sell signals, identify market trends and reversals, and provide insights into market momentum. However, it is important to note that the MACD should be used in conjunction with other technical indicators and should not be relied upon as the sole basis for trading decisions.
Yes, MACD is widely used by professional traders. It is a popular indicator that helps traders identify potential trend reversals, as well as generate buy and sell signals.
There are several advantages of using MACD in trading. Firstly, it is a versatile indicator that can be used in different market conditions and timeframes. Secondly, it provides clear signals when a trend reversal or momentum shift is occurring. Lastly, it is easy to interpret and can be combined with other technical indicators for increased accuracy.
While MACD is a popular indicator, it does have some limitations. One drawback is that it can generate false signals in ranging or choppy markets. Additionally, it may lag behind price movements during fast market conditions. It is important for traders to take these limitations into consideration and use MACD in conjunction with other indicators or tools.
Yes, MACD can be used for day trading. It can help traders identify potential trend reversals or momentum shifts on shorter timeframes. However, it is important to use other indicators or tools in conjunction with MACD for confirmation and to filter out false signals.
To learn how to use MACD effectively, it is recommended to study resources that explain the indicator in detail. This can include books, online tutorials, or even seeking guidance from experienced traders. Additionally, practicing on a demo trading account can help familiarize yourself with how MACD works in real-time market conditions.

Choosing the Best Stop-Loss Strategy for Your Investments Stop-loss is a risk management tool widely used by traders and investors to limit potential …
Read Article
Updating Your Yamaha Receiver Firmware: A Step-by-Step Guide Keeping your Yamaha receiver up to date is essential for ensuring optimal performance and …
Read Article
Predictions for AUD to USD Exchange Rate in 2023 The AUD to USD exchange rate is a crucial indicator for both the Australian and United States …
Read Article
What is the Currency Symbol for the UK? The United Kingdom uses the pound sterling as its official currency. The currency symbol for the pound …
Read Article
Is it Possible to Become a Millionaire Trading Binary Options? Binary options trading has gained significant popularity in the financial world, …
Read Article
Bank Transfer Fee: How Much Does It Cost? Bank transfers are a common method of sending money from one bank account to another. They can be used for …
Read Article


