


How to Activate Option Trading in Kotak: A Step-by-Step Guide
Activate option trading in Kotak: A step-by-step guide Trading options can be a great way to diversify your investment portfolio and potentially …
Read Article
When it comes to analyzing price movements in the financial markets, traders rely on a variety of technical indicators. One such indicator is the Moving Average of Oscillator (OsMA), a popular tool used in MetaTrader 4 (MT4) for determining potential trend reversals and identifying entry and exit points in a trade.
The OsMA indicator is derived from the MACD (Moving Average Convergence Divergence) and consists of two lines: the main line and the signal line. The main line represents the difference between the MACD line and the signal line, while the signal line is a moving average of the main line. By comparing the two lines, traders can gauge the momentum and strength of a trend.
The Moving Average of Oscillator indicator is particularly useful in identifying divergences between the price and the oscillator. Divergences occur when the price moves in one direction while the oscillator moves in the opposite direction. These divergences can signal potential trend reversals and provide traders with valuable trading opportunities.
In this comprehensive guide, we will explore the various components of the Moving Average of Oscillator indicator in MT4, including its calculation, interpretation, and application in trading strategies. We will also discuss its strengths and limitations, and provide examples of how to use it effectively in different market scenarios. Whether you are a beginner trader or an experienced professional, this guide will equip you with the necessary knowledge to make informed trading decisions using the OsMA indicator.
The Moving Average of Oscillator (OsMA) is a technical indicator that measures the momentum of an asset’s price movement. It is derived from the difference between the oscillator and its moving average. The OsMA indicator helps identify potential trend reversals and overbought/oversold conditions.
The calculation methodology of the OsMA indicator involves the following steps:
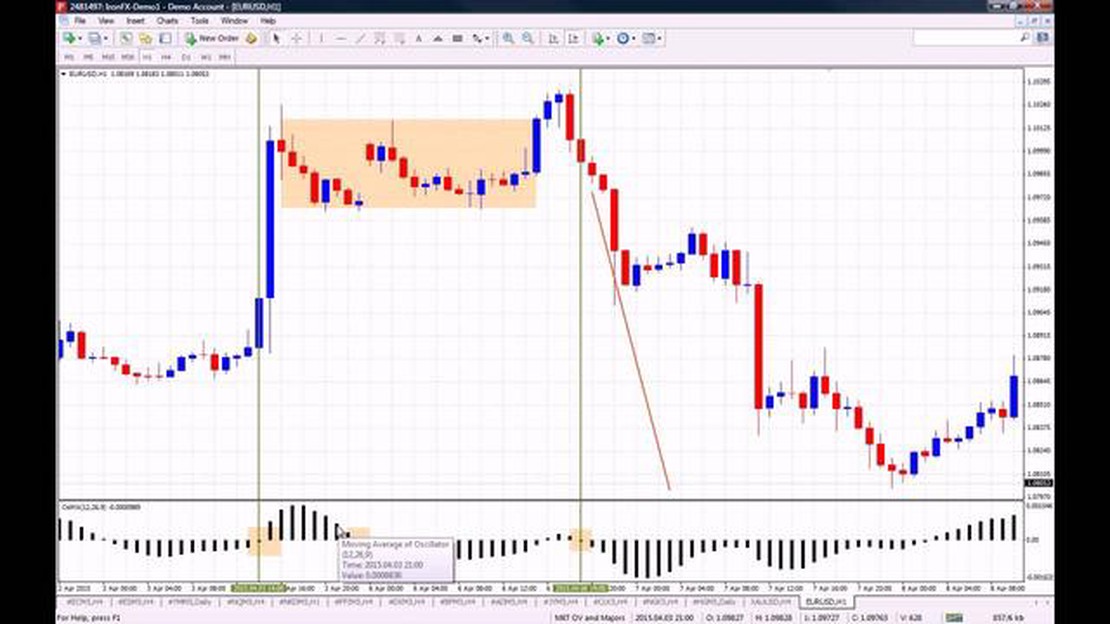
The Moving Average of Oscillator indicator is typically displayed as a histogram, with positive values indicating bullish momentum and negative values indicating bearish momentum. Traders often look for divergences between the indicator and price action to identify potential trading opportunities.
In conclusion, the Moving Average of Oscillator Indicator is a useful tool for understanding the momentum and trend reversal areas in the price movement of an asset. Its calculation methodology involves calculating the oscillator, calculating the moving average of the oscillator, and deriving the Moving Average of Oscillator indicator by subtracting the two values. Traders can use this indicator to make informed trading decisions and identify potential entry and exit points in the market.

The Moving Average of Oscillator (OsMA) is a popular technical analysis tool used by forex traders to identify possible trend reversals and generate buy or sell signals.
The OsMA consists of two components: the oscillator and the signal line. The oscillator is calculated by subtracting the long-term moving average from the short-term moving average. The signal line is a moving average of the oscillator.
When interpreting the signals generated by the OsMA, traders should pay attention to the following:
| Signal | Interpretation |
|---|---|
| OsMA above zero | Positive signal indicating bullish market conditions. Traders may consider opening long positions. |
| OsMA below zero | Negative signal indicating bearish market conditions. Traders may consider opening short positions. |
| OsMA crossing above signal line | Bullish signal indicating potential trend reversal or continuation of an uptrend. Traders may consider opening long positions. |
| OsMA crossing below signal line | Bearish signal indicating potential trend reversal or continuation of a downtrend. Traders may consider opening short positions. |
| OsMA diverging from price | Signal of weakening trend momentum. Traders may consider closing or reducing their positions. |
| OsMA converging with price | Signal of strengthening trend momentum. Traders may consider increasing their positions. |
Read Also: Which Countries have ETS? Find out where carbon pricing is being implemented
It is important for traders to use the OsMA signals in conjunction with other technical analysis tools and indicators to confirm their trading decisions. Additionally, traders should practice proper risk management and consider the overall market conditions before placing trades based on OsMA signals.
In conclusion, the Moving Average of Oscillator Indicator can be a valuable tool in a trader’s technical analysis arsenal. By carefully interpreting its signals, traders can gain insights into possible market trends and make informed trading decisions.
Read Also: Which country has the highest trade volume with Kenya?
The Moving Average of Oscillator (OsMA) indicator is a popular technical analysis tool used in MT4 to identify potential trend reversals and generate trading signals. It is derived from the MACD (Moving Average Convergence Divergence) indicator and represents the difference between the MACD line and the signal line.
The OsMA indicator is plotted as a histogram, with positive values indicating bullish momentum and negative values indicating bearish momentum. Traders can use it to confirm the direction of the trend and identify potential entry and exit points.
To apply the OsMA indicator in MT4, follow these steps:
Once the OsMA indicator is applied to your chart, you can interpret its signals and use them to guide your trading decisions. Here are some commonly used strategies:

Remember, the OsMA indicator is just one tool among many in your trading arsenal. It is important to use it in conjunction with other technical indicators, price action analysis, and risk management strategies to make informed trading decisions.
The Moving Average of Oscillator (OsMA) is an indicator in MT4 that shows the difference between the oscillator and its moving average. It helps to identify potential trends and reversals in the market.
The Moving Average of Oscillator Indicator calculates the difference between the oscillator value and its moving average. It then smoothes out this difference with another moving average, resulting in the OsMA line. Positive values indicate upward momentum, while negative values indicate downward momentum.
The Moving Average of Oscillator Indicator can be used to identify potential trend reversals. When the OsMA line crosses above zero, it signals a bullish trend, and when it crosses below zero, it signals a bearish trend. Traders can also look for divergences between the price and the OsMA line to identify potential trading opportunities.
Yes, the Moving Average of Oscillator Indicator can be customized in MT4. Traders can adjust the input parameters, such as the period of the oscillator and the moving averages, to suit their trading strategy and preferences. They can also change the color and style of the OsMA line to make it more visually appealing.
The Moving Average of Oscillator Indicator can be applied to various markets and timeframes. However, it is most commonly used in trending markets, as it helps to identify potential reversals in the trend. In range-bound markets, the OsMA line may give false signals, so it is important to use it in conjunction with other indicators or price action analysis.

Activate option trading in Kotak: A step-by-step guide Trading options can be a great way to diversify your investment portfolio and potentially …
Read Article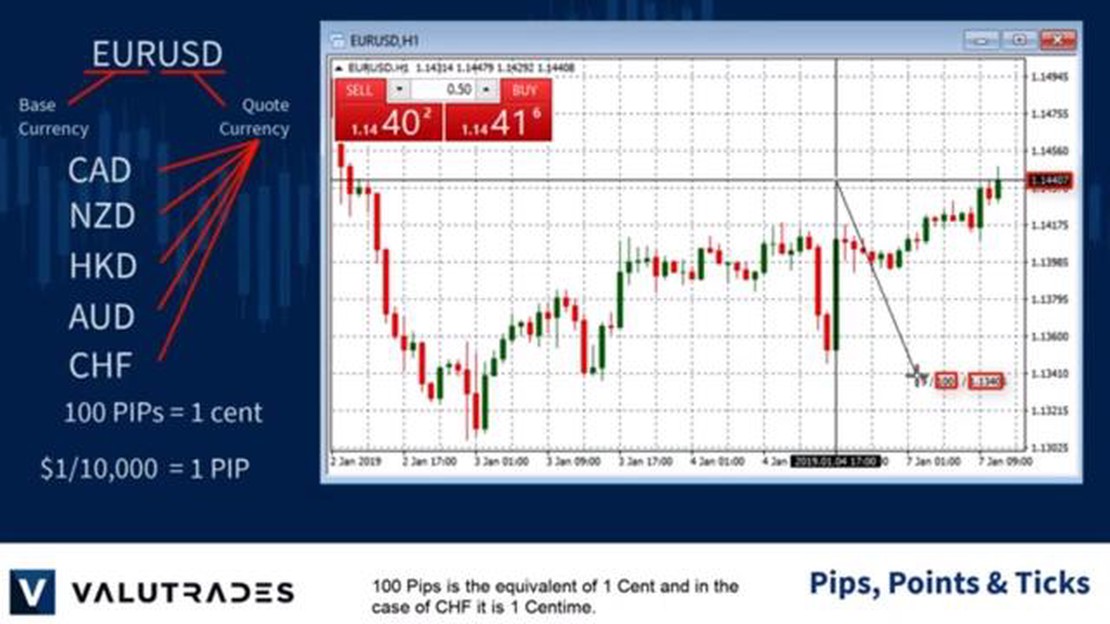
What is the Value of a Euro Currency Tick? Currency conversion is an essential aspect of international trade and investment. Understanding the value …
Read Article
Understanding ISO and Its Significance in Stock Options When it comes to stock options, there are several terms and acronyms that can be confusing for …
Read Article
Is there a minimum opening deposit? When opening a new account, one of the first things you may be wondering is if there is a minimum opening deposit …
Read Article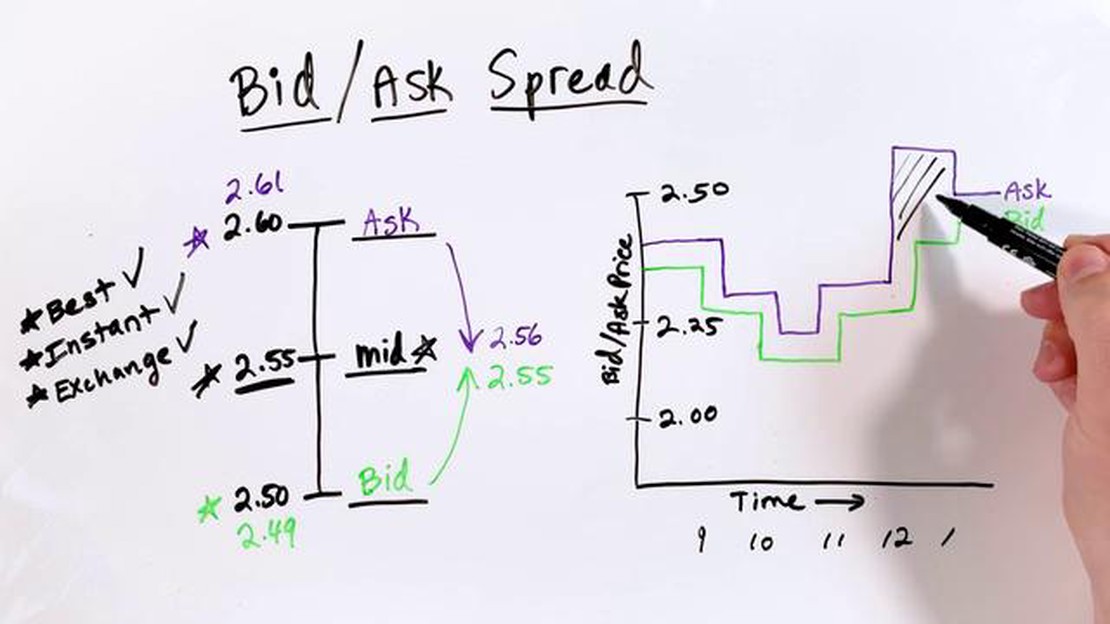
Understanding Bid Ask in Option Trading Option trading is a complex and dynamic market where investors can speculate on the future movement of an …
Read Article
Understanding the Forex Bonus: What You Need to Know If you’re interested in trading on the foreign exchange market, you’ve likely come across the …
Read Article


