


Is it smart to trade in an iPhone? | Pros and Cons of Trading In
Should I trade in my iPhone? When it’s time to upgrade to a newer iPhone, many people wonder what to do with their old device. One option is to trade …
Read Article
If you’re new to investing in the stock market, understanding how to analyze stock charts is crucial. One useful tool in technical analysis is the Simple Moving Average (SMA). This indicator helps traders identify trends and potential entry or exit points for stocks.
The SMA is calculated by adding the closing prices of a stock over a certain number of periods and then dividing that sum by the number of periods. It is called “simple” because all closing prices are given equal weightage. The resulting line on a stock chart represents the average price of the stock over the specified time period.
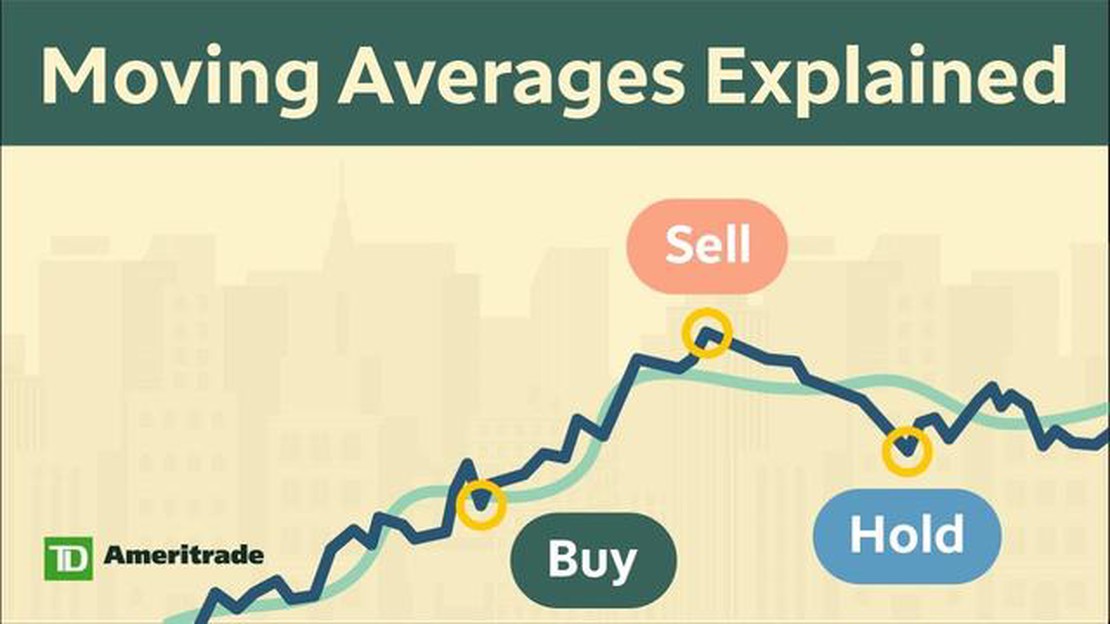
Traders typically use the SMA to identify when a stock is in an uptrend or downtrend. If the stock price is consistently above the SMA, it suggests an uptrend, while a price below the SMA indicates a downtrend. Additionally, traders can use the crossover of different SMA time periods to signal potential entry or exit points.
While the SMA is a helpful tool, it’s important to note that it is a lagging indicator, meaning it reacts to price movements after they occur. Therefore, it’s often used in conjunction with other technical indicators and fundamental analysis to make well-informed investment decisions.
Key takeaway: The Simple Moving Average is a popular tool in technical analysis that helps traders identify trends and potential entry or exit points for stocks. While it is a lagging indicator, it can be used in combination with other indicators and analysis for more accurate predictions.
The Simple Moving Average (SMA) is a commonly used technical indicator in stock market analysis. It is used to analyze the overall price trend of a stock or asset by calculating the average price over a specified period of time.
The SMA is calculated by adding the closing prices of a stock over a certain number of periods and then dividing it by the number of periods. The resulting value represents the average price over that time period.
Traders and investors use the SMA to identify and confirm trends in the stock market. It is often used in conjunction with other technical indicators to make informed trading decisions.
The SMA is most commonly used to determine support and resistance levels. When the price of a stock is above the SMA, it is considered to be in an uptrend and the SMA line acts as a support level. On the other hand, when the price is below the SMA, it indicates a downtrend and the SMA acts as a resistance level.
Another usage of the SMA is to generate buy and sell signals. When the price crosses above the SMA, it is often seen as a buy signal, indicating that it may be a good time to enter a long position. Conversely, when the price crosses below the SMA, it is seen as a sell signal, suggesting that it may be a good time to sell or short the stock.
It is important to note that the SMA is a lagging indicator, meaning that it is based on historical data and may not always accurately predict future price movements. Traders and investors should use the SMA in conjunction with other technical indicators and fundamental analysis to make well-informed trading decisions.

A Simple Moving Average (SMA) is a widely used technical indicator that helps traders and investors identify trends and potential reversal points in financial markets. It is a calculation of the average price of a security over a specific time period.
The SMA smooths out price data by creating a continually updating average price, which helps to remove short-term fluctuations and noise in the market. This makes the SMA a useful tool for identifying the overall direction of a stock’s price movement.
The calculation of the SMA involves adding up a specific number of closing prices and dividing the sum by the number of time periods considered. For example, a 10-day SMA would add up the closing prices of the last 10 trading days and divide the sum by 10.
The SMA can be applied to various timeframes, ranging from minutes to years, depending on the trader’s preference and the market being analyzed. The longer the timeframe, the smoother the moving average line will be.
Read Also: How to Calculate Volatility: A Step-by-Step Guide
Traders typically use the SMA in combination with other technical indicators to confirm signals and identify potential buying or selling opportunities. For example, when the price of a stock crosses above its SMA, it may indicate a bullish signal, while a price crossing below the SMA may signal a bearish trend.
It is important to note that the SMA is a lagging indicator, meaning it reflects past price action and may not capture sudden changes or reversals in the market. Traders often use shorter-term SMAs, such as 50-day or 200-day, for identifying trends, and combine them with other indicators for more accurate analysis.
Read Also: Essential Tools for Forex Trading: A Comprehensive Guide
In conclusion, the Simple Moving Average is a popular tool in technical analysis that helps traders identify trends and potential reversal points in financial markets. By smoothing out price data and providing an average price over a specific time period, the SMA can assist traders in making more informed trading decisions.
The Simple Moving Average (SMA) is a widely used technical analysis tool that helps investors and traders analyze price trends on stock charts. By calculating the average price over a specific time period, the SMA smooths out short-term fluctuations and provides a clearer picture of the overall trend.
To calculate the SMA, you add up a series of closing prices for a specific time period and divide the sum by the number of periods. For example, if you are calculating the 50-day SMA, you would add up the closing prices for the past 50 days and divide the sum by 50.
The SMA is often used in conjunction with other technical indicators to make trading decisions. When the price is above the SMA, it is usually considered a bullish signal, indicating that the stock is in an uptrend. Conversely, when the price is below the SMA, it is usually considered a bearish signal, indicating that the stock is in a downtrend.

Traders also look for crossovers between different SMA time periods as a potential trading signal. For example, if the shorter-term SMA, such as the 20-day SMA, crosses above the longer-term SMA, such as the 50-day SMA, it is considered a bullish signal. On the other hand, if the shorter-term SMA crosses below the longer-term SMA, it is considered a bearish signal.
It’s important to note that the SMA is a lagging indicator, meaning it may not always provide timely signals. It is best used in combination with other technical indicators and analysis techniques to confirm trading decisions.
Benefits of Using SMA:
Conclusion:
The Simple Moving Average is a popular tool for analyzing stock charts and identifying potential trading opportunities. By calculating the average price over a specific time period, the SMA helps smooth out short-term volatility and provides a clearer view of the overall trend. Traders can use the SMA in conjunction with other indicators to confirm trading decisions and improve their chances of success in the stock market.
A simple moving average is a statistical calculation that helps to identify trends and patterns in stock prices over a certain period of time. It is calculated by taking the average price of a stock over a specified number of periods.
The simple moving average can be used to identify potential buying or selling opportunities. For example, if the current stock price is above the moving average, it may indicate an uptrend and a potential buying opportunity. Conversely, if the stock price is below the moving average, it may suggest a downtrend and a potential selling opportunity.
The optimal period for calculating the simple moving average depends on the individual investor’s trading strategy and the time frame they are analyzing. Shorter periods, such as 10 or 20 days, are often used for short-term trading, while longer periods, such as 50 or 200 days, are more commonly used for long-term investing.
Yes, there are some limitations to using the simple moving average. Firstly, it is a lagging indicator, which means it may not provide timely signals for entering or exiting trades. Additionally, it may not be effective in volatile or choppy market conditions. It is important to use the simple moving average in conjunction with other technical analysis tools and indicators to confirm signals and make informed investment decisions.

Should I trade in my iPhone? When it’s time to upgrade to a newer iPhone, many people wonder what to do with their old device. One option is to trade …
Read Article
Discovering the Safest and Most Profitable Option Strategy When it comes to investing in options, finding the safest and most profitable strategy is a …
Read Article
What is the minimum deposit for Ubuntu? Ubuntu, the popular Linux-based operating system, offers users a reliable and secure platform for their …
Read Article
Who is the greatest forex trader of all time? Forex trading, often referred to as foreign exchange trading, is a global market where currencies are …
Read Article
What is the IV of Tesla stock? Implied Volatility (IV) is a crucial concept in the world of options trading, and it plays a significant role in …
Read Article
Master the Art of Forex Strategies: A Comprehensive Guide When it comes to trading on the foreign exchange market, having a strong understanding of …
Read Article


