


Owner of Ossia International - Revealed!
Owner of Ossia International Ossia International, a global leader in wireless power technology, has finally revealed the identity of its secretive …
Read Article
If you’re new to trading and looking to learn how to effectively analyze market trends and make informed trading decisions, the ADX DMI indicator can be a valuable tool in your trading arsenal. ADX DMI, which stands for Average Directional Index and Directional Movement Index, is a technical analysis indicator used to measure the strength and direction of a trend. By understanding how to interpret the ADX DMI indicator, you can gain insights into market momentum and potentially identify profitable trading opportunities.
The ADX DMI indicator consists of multiple components, including the ADX line, the Positive Directional Indicator (+DI), and the Negative Directional Indicator (-DI). The ADX line measures the strength of the trend, while the +DI and -DI lines indicate the direction of the trend. By analyzing the interaction between these lines, traders can determine whether the market is trending or ranging, and whether it’s a good time to enter or exit a trade.
One of the key benefits of using the ADX DMI indicator is its ability to filter out noise and provide a clear picture of the underlying trend. This can help traders avoid false signals and stay focused on high probability trading setups. Additionally, the ADX DMI indicator can be used on various timeframes and across different financial instruments, making it a versatile tool for traders of all experience levels.
In this comprehensive guide, we will walk you through the basics of the ADX DMI indicator, explain how to interpret its components, and provide practical examples of how to use it in your trading strategy. Whether you’re a beginner looking to gain a solid understanding of technical analysis or an experienced trader looking to enhance your trading system, this guide will equip you with the knowledge and skills needed to effectively trade ADX DMI.
ADX DMI (Average Directional Index and Directional Movement Index) is a technical analysis indicator that is used to measure the strength and direction of a trend in the financial markets. It was developed by J. Welles Wilder and introduced in his book, “New Concepts in Technical Trading Systems,” in 1978.
The ADX DMI indicator is made up of three lines: the ADX line, the +DI line, and the -DI line. The ADX line measures the strength of the trend, while the +DI and -DI lines measure the direction of the trend. The +DI line is used to represent the bullish direction, while the -DI line is used to represent the bearish direction.
The ADX line is plotted on a scale from 0 to 100, with values below 20 indicating a weak trend and values above 40 indicating a strong trend. Traders can use the ADX line to determine whether a trend is gaining strength or losing momentum.

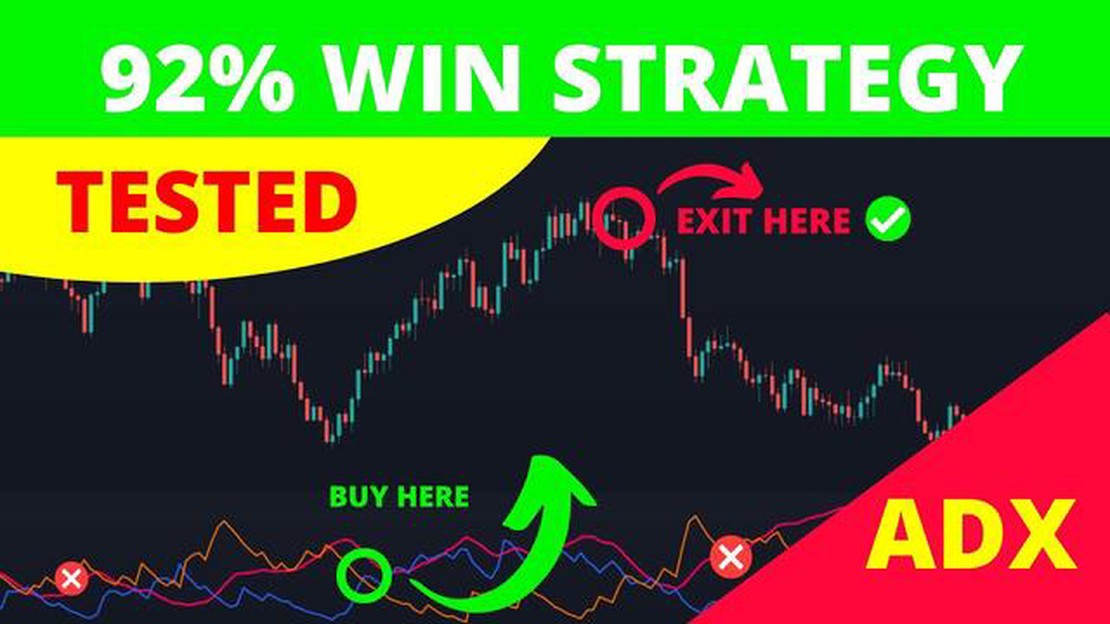
The +DI and -DI lines are plotted on a scale from 0 to 100 as well. When the +DI line crosses above the -DI line, it signals a bullish trend, and when the -DI line crosses above the +DI line, it signals a bearish trend. Traders can use these crossovers to generate buy or sell signals.
Overall, the ADX DMI indicator is a valuable tool for traders who want to identify and capitalize on trends in the financial markets. By providing information about both the strength and direction of a trend, it can help traders make more informed trading decisions.
The Average Directional Index (ADX) and the Directional Movement Indicators (DMI) are popular technical indicators used by traders to analyze the strength and direction of a trend in the financial markets. These indicators were developed by J. Welles Wilder Jr. and can be applied to various asset classes such as stocks, forex, commodities, and cryptocurrencies.
The ADX is a numerical value that represents the strength of a trend, regardless of its direction. It ranges from 0 to 100, with higher values indicating a stronger trend. Traders often use ADX values above 25 to confirm the presence of a trending market. A rising ADX suggests that the trend is strengthening, while a falling ADX indicates a weakening trend.
Read Also: Mastering the Art of Fundamental Analysis in Forex: A Comprehensive Guide
The DMI consists of two lines, the positive directional indicator (+DI) and the negative directional indicator (-DI). These lines help determine the direction of the current trend. The +DI measures the strength of the upward movement, while the -DI measures the strength of the downward movement. When the +DI is above the -DI, it indicates an uptrend, and when the -DI is above the +DI, it suggests a downtrend. Traders look for crossovers between these two lines as potential entry or exit signals.
Another important component of the DMI is the ADX line, which measures the strength of the trend. When the ADX is rising, it indicates a strong trend, and when it is falling, it suggests a weak trend. Traders often use the ADX line in conjunction with the +DI and -DI lines to confirm the strength and direction of a trend.
By understanding and utilizing the ADX DMI indicators, traders can gain insights into the market’s trendiness, identify potential entry and exit points, and make more informed trading decisions. It is important to remember that no indicator is foolproof and should be used in conjunction with other technical analysis tools and risk management strategies.
Trading with the Average Directional Index (ADX) and the Directional Movement Index (DMI) can be a powerful strategy for identifying trends and determining when to enter or exit trades.
Read Also: Understanding the FTSE JSE Index: An Overview of South Africa's Premier Stock Market Index
Here are some steps to help you trade ADX DMI effectively:
Remember, trading with ADX DMI involves risk, and it is important to develop a trading plan and adhere to proper risk management principles. By understanding and implementing the steps outlined above, you can improve your trading accuracy and increase your chances of success.
ADX DMI stands for Average Directional Index and Directional Movement Index. It is a technical analysis tool used to measure the strength and trend of a market.
ADX DMI is calculated using a formula that takes into account the difference between two consecutive lows and two consecutive highs.

ADX DMI provides us with information about the strength of a trend and whether it is likely to continue or reverse.
Beginners can use ADX DMI to identify and confirm trends, as well as to determine potential entry and exit points for trades.
While ADX DMI is a useful tool, it is not without its limitations. It may not work well in choppy or range-bound markets, and it should be used in combination with other indicators for better accuracy.
ADX DMI, also known as Average Directional Index and Directional Movement Index, is a technical indicator that helps traders identify the strength and direction of a trend in a market.
ADX DMI can be used in trading by providing information on the strength of a trend and identifying potential buy or sell signals. Traders can use the ADX line to determine if a trend is strong or weak, and the DI+ and DI- lines to identify the direction of the trend. Crossovers between the DI+ and DI- lines can be used as signals to go long or short.

Owner of Ossia International Ossia International, a global leader in wireless power technology, has finally revealed the identity of its secretive …
Read Article
What happens when the stock price crosses above the upper Bollinger Band? The Bollinger Bands are a popular technical analysis tool used by traders …
Read Article
Understanding 0.1 Lot Size in Octafx: A Detailed Explanation In the world of forex trading, lot size is a crucial concept that every trader needs to …
Read Article
Earning Potential of Professional Forex Traders Forex trading can be an incredibly lucrative venture for those who possess the necessary skills and …
Read Article
Who is the CEO of IPC Systems? IPC Systems is a global provider of communication and networking solutions for the financial markets. With a strong …
Read Article
Restrictions and time limits for holding restricted stock Restricted stock, also known as restricted share units (RSUs), is a type of compensation …
Read Article


