


Understanding Discounted Stock Option 409A and its Benefits
Understanding Discounted Stock Option 409A: All You Need to Know In today’s fast-paced and highly competitive business environment, offering employee …
Read Article

Chart analysis is an essential skill for traders looking to succeed in intraday trading. By studying and interpreting price charts, traders can identify patterns, trends, and key levels that can help them make informed trading decisions. In this article, we will explore some of the key aspects of studying a chart for successful intraday trading.
One important aspect of studying a chart is understanding the different types of charts available. The most commonly used charts in intraday trading are line charts, bar charts, and candlestick charts. Each type of chart provides different information and insights into price movements, and traders should be familiar with all three types to gain a comprehensive understanding of the market.
Another crucial aspect of studying a chart is identifying and analyzing key support and resistance levels. Support levels are areas where the price tends to find buying pressure, while resistance levels are areas where the price tends to encounter selling pressure. By analyzing these levels, traders can make more accurate predictions about price movements and set appropriate stop-loss and take-profit levels.

Furthermore, traders should pay attention to chart patterns, such as triangles, head and shoulders, and double tops/bottoms. These patterns can provide valuable information about potential trend reversals or continuations and can help traders anticipate future price movements. By studying and recognizing these patterns, traders can improve their entry and exit timing and increase their overall profitability.
In conclusion, studying a chart is a vital skill for successful intraday trading. Traders must be proficient in analyzing different types of charts, identifying key support and resistance levels, and recognizing chart patterns. By honing these skills and continuously studying and learning from charts, traders can improve their trading performance and increase their chances of success in the highly competitive intraday trading market.
Intraday trading is a type of trading where traders buy and sell securities within the span of a day. Unlike long-term investing, which involves holding onto investments for a longer period of time, intraday trading aims to take advantage of short-term price movements.
Successful intraday trading requires a solid understanding of how the market works and the ability to analyze charts effectively. By studying charts, traders can identify patterns and trends that can help them make informed trading decisions.
Read Also: What Does Forex Mean? A Guide to Understanding Forex Trading
When studying a chart for intraday trading, it is important to focus on key elements such as:
It is also important to consider the timeframes used for intraday trading. Shorter timeframes, such as 1 minute or 5 minutes, can provide more detailed information about price movements, while longer timeframes, such as 1 hour or 4 hours, can provide a broader perspective.
By understanding these key elements and studying charts effectively, traders can improve their chances of success in intraday trading. It is important to practice and continuously learn from the market to refine trading strategies and adapt to changing market conditions.
Intraday trading, also known as day trading, is an important aspect of financial markets. It involves buying and selling financial instruments within the same trading day. Intraday traders aim to take advantage of short-term price movements to make profits.
There are several reasons why intraday trading is important:
| 1. Liquidity: | Intraday trading adds liquidity to the market. It ensures that there are enough buyers and sellers participating in the market, which improves price discovery and reduces the bid-ask spread. |
| 2. Profit Potential: | Intraday trading provides traders with the opportunity to make profits from short-term price fluctuations. By actively monitoring the market and taking quick trades, traders can take advantage of any favorable price movements. |
| 3. Risk Management: | Intraday trading allows traders to manage their risk more effectively. Since intraday traders close their positions before the end of the trading day, they are not exposed to overnight risk. This reduces the possibility of unexpected events affecting their trades. |
| 4. Flexibility: | Intraday trading offers flexibility in terms of trading strategies and time commitment. Traders can choose from various approaches such as scalping, day trading, or swing trading, depending on their risk appetite and investment goals. |
| 5. Skill Development: | Intraday trading requires traders to develop and hone their analytical skills. They need to study charts, analyze patterns, and interpret market data to make informed trading decisions. This constant learning process helps traders improve their skills over time. |
Read Also: The 4 Types of API: Explained and Compared | YourSiteName
In conclusion, intraday trading plays a crucial role in financial markets. It provides liquidity, profit potential, risk management, flexibility, and an opportunity for skill development. However, it’s important to note that intraday trading involves higher levels of risk and requires traders to be disciplined and well-informed.
The first step in studying a chart for intraday trading is to identify the timeframe you want to trade in. This will help you determine the level of detail you need to analyze the chart.
Some common chart patterns that traders look for in intraday trading are the head and shoulders pattern, double top/bottom pattern, ascending/descending triangle pattern, and the bullish/bearish flag pattern.
You can use moving averages to study a chart for intraday trading by looking for crossover points between different moving averages. These crossovers can indicate potential entry or exit points for trades.

Some technical indicators that can help you study a chart for intraday trading are the Relative Strength Index (RSI), Moving Average Convergence Divergence (MACD), and Bollinger Bands. These indicators can provide insights into market trends and potential price reversals.

Understanding Discounted Stock Option 409A: All You Need to Know In today’s fast-paced and highly competitive business environment, offering employee …
Read Article
Understanding Error Code 138 on MT4: Common Causes and Solutions Error code 138, also known as “requote” error, is a common issue faced by traders …
Read Article
Settlement of FX Options: A Comprehensive Guide When trading in the foreign exchange (FX) market, it is important to understand how FX options are …
Read Article
What is chicken stock stock? When it comes to cooking, chicken stock is an essential ingredient that can elevate the flavor of any dish. But what …
Read Article
Exponential Moving Average Span In the world of technical analysis, the Exponential Moving Average (EMA) is a widely used tool for predicting future …
Read Article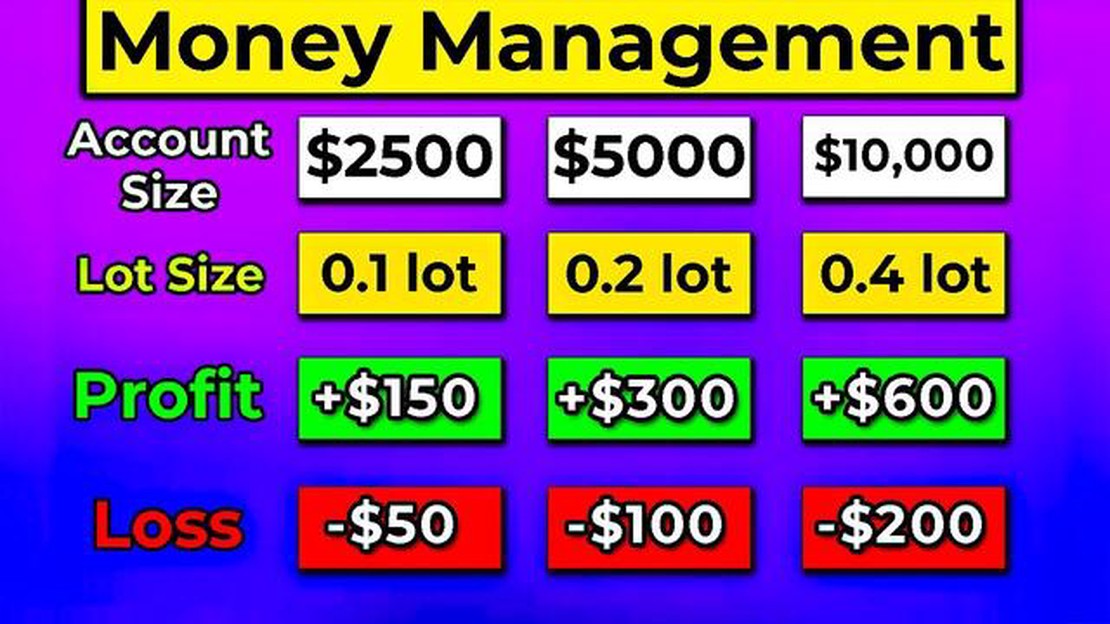
Calculating Risk per Trade: A Complete Guide Calculating risk per trade is a crucial step for any trader looking to manage their investments …
Read Article


