


Does Australia have M2? Discover Australia's Highway Network
Does Australia Have M2? Australia, known for its vast and diverse landscapes, is home to an extensive highway network that connects cities, towns, and …
Read Article
Technical analysis plays a crucial role in the world of financial markets, helping traders and investors make informed decisions based on price patterns and market indicators. One such indicator is the Moving Average Convergence Divergence (MACD), which is widely used by traders to identify potential trend reversals, generate buy and sell signals, and measure the overall momentum of an asset.
But is MACD a leading indicator? Many traders ask themselves this question as they strive to predict future price movements and maximize their profits. In this article, we will explore the role of MACD in technical analysis and discuss whether it can truly act as a leading indicator or if it should be used in conjunction with other tools.
MACD is a versatile indicator that consists of two moving averages, a faster one and a slower one, along with a histogram. By analyzing the convergence and divergence of these moving averages, traders can determine whether an asset is in a bullish or bearish market condition and make appropriate trading decisions. While MACD can provide valuable insights into the current market trend, it is not necessarily a leading indicator that can accurately predict future price movements.
Despite its limitations, MACD remains an important tool in a trader’s arsenal. It can help confirm the strength of a trend, identify potential entry and exit points, and provide additional confirmation when used in conjunction with other indicators. By combining MACD with other technical analysis tools, such as support and resistance levels, trendlines, and candlestick patterns, traders can increase their chances of making profitable trades and navigating the volatile financial markets.
While MACD is a popular indicator, it is not considered a leading indicator. Leading indicators are used to predict future price movements and provide signals ahead of time. They are often used to try and identify potential reversals or trends before they happen. Examples of leading indicators include the Relative Strength Index (RSI), the Stochastic Oscillator, and the Williams %R.
On the other hand, the MACD is a lagging indicator. It is calculated based on historical price data and provides signals after the fact. The MACD line is derived from the difference between two moving averages, while the signal line is a moving average of the MACD line. The histogram represents the difference between the MACD line and the signal line and provides additional insight into the strength of the trend.
Although the MACD is not a leading indicator, it is still valuable in technical analysis. It can help confirm trends, identify potential reversals, and provide signals for entry and exit points. Traders often use the MACD in conjunction with other indicators to receive more accurate signals and make more informed trading decisions.

In conclusion, while the MACD is not a leading indicator, it remains a popular and useful tool in technical analysis. Traders should understand its limitations and use it in combination with other indicators to improve its effectiveness.
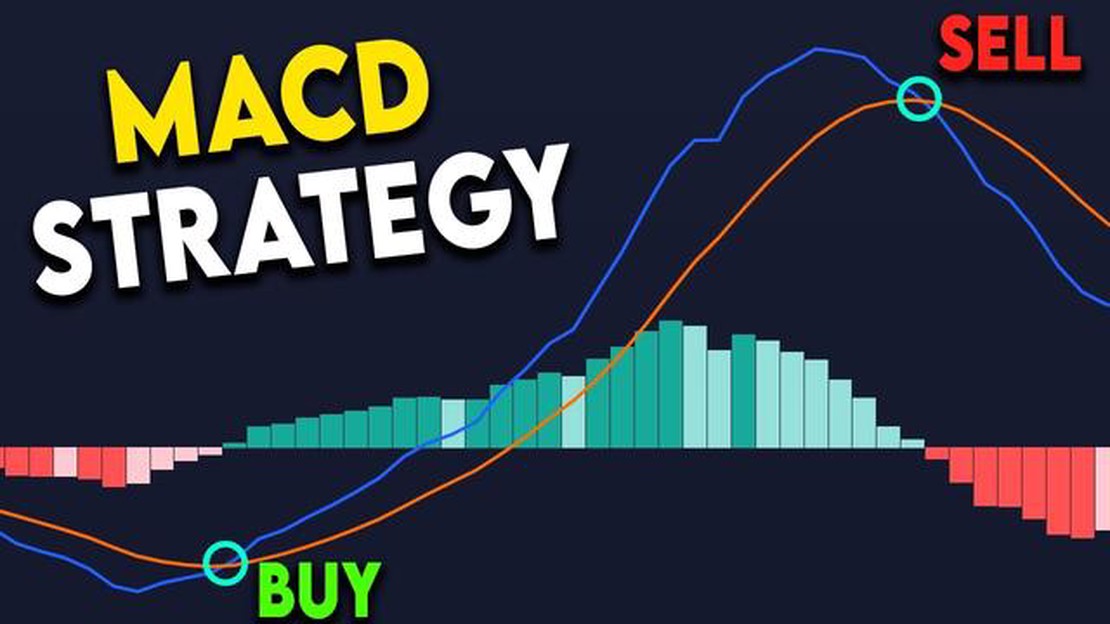
One of the key roles of MACD in technical analysis is detecting potential trend reversals. The MACD line and the signal line cross each other when a trend is about to change direction. A bullish crossover occurs when the MACD line crosses above the signal line, signaling a potential upward trend. Conversely, a bearish crossover occurs when the MACD line crosses below the signal line, indicating a potential downward trend. This information allows traders to anticipate trend reversals and adjust their trading strategy accordingly.
In addition to identifying trend reversals, MACD can also generate buy and sell signals. When the MACD line crosses above the signal line, it generates a buy signal, suggesting that it may be a good time to enter a long position. Conversely, when the MACD line crosses below the signal line, it generates a sell signal, indicating that it may be a good time to exit a long position or enter a short position. By using MACD signals in conjunction with other technical analysis tools, traders can increase their chances of making profitable trades.
Read Also: Check NCB Exchange Rate Today
Furthermore, MACD can provide insights into the strength of a trend. The histogram, which represents the difference between the MACD line and the signal line, fluctuates above and below the zero line. When the histogram is above the zero line, it indicates that the bullish momentum is strong, and when it is below the zero line, it suggests that the bearish momentum is strong. Traders can use the histogram to gauge the strength of a trend and make informed decisions about whether to enter or exit a trade.
In conclusion, MACD plays a crucial role in technical analysis by helping traders identify potential trend reversals, generate buy and sell signals, and assess the strength of a trend. By using MACD in conjunction with other technical analysis tools, traders can gain valuable insights into market trends and make more informed trading decisions. Whether used as a standalone indicator or in combination with other indicators, MACD is a valuable tool for traders looking to improve their trading performance.
In technical analysis, the Moving Average Convergence Divergence (MACD) is considered to be a leading indicator. This means that it provides signals in advance of a potential change in price direction.
The MACD is composed of two lines - the MACD line and the signal line. The MACD line is calculated by subtracting the 26-day exponential moving average (EMA) from the 12-day EMA, while the signal line is a 9-day EMA of the MACD line.
Traders use the MACD line and the signal line to generate signals for buying and selling stocks or other assets. When the MACD line crosses above the signal line, it is considered a bullish signal, indicating that it may be a good time to buy. On the other hand, when the MACD line crosses below the signal line, it is considered a bearish signal, indicating that it may be a good time to sell.
One of the reasons why the MACD is considered a leading indicator is because it can identify potential trend reversals before they actually occur. By comparing the relationship between the MACD line and the signal line, traders can anticipate changes in price direction.
Read Also: Understanding the Difference Between Options Trading and Stocks
Another reason why the MACD is a leading indicator is because it can help traders identify overbought or oversold conditions in the market. When the MACD line diverges significantly from the signal line, it suggests that the asset may be overbought or oversold, indicating that a price reversal may be on the horizon.
However, it’s important to remember that no indicator is foolproof, and the MACD should be used in conjunction with other technical analysis tools and strategies. Additionally, it’s essential to consider other factors such as fundamental analysis and market conditions when making trading decisions.
Overall, the MACD is a valuable tool for traders as it provides insight into potential trend reversals and overbought/oversold conditions. By understanding how the MACD works as a leading indicator, traders can make more informed decisions and improve their chances of success in the market.

MACD, or Moving Average Convergence Divergence, is a popular technical indicator used in technical analysis. It consists of two lines, the MACD line and the signal line, as well as a histogram. Traders use MACD to identify potential trend reversals, confirm the strength of a trend, and generate buy or sell signals. The MACD line is calculated by subtracting a longer-term exponential moving average (EMA) from a shorter-term EMA, while the signal line is a smoothed average of the MACD line. The histogram represents the difference between the MACD line and the signal line. Traders look for crossovers, divergences, and histogram patterns to make trading decisions.
MACD is considered a lagging indicator because it is based on historical price data. It calculates the difference between two moving averages and provides signals after a trend has already been established. However, it can also be used as a leading indicator when combined with other technical analysis tools. Traders often look for divergences or other patterns in the MACD to anticipate potential trend reversals.
While MACD is not designed to predict future price movements with certainty, it can provide valuable information about the strength and direction of a trend. Traders can use MACD to identify potential trend reversals and generate buy or sell signals. However, it is important to note that MACD should be used in conjunction with other technical analysis tools and market indicators for more accurate predictions.
One limitation of using MACD as a leading indicator is that it may produce false signals or generate signals too late in certain market conditions. This can result in missed opportunities or entering trades too late. Additionally, MACD is a lagging indicator at its core, as it is based on historical price data. Traders should be aware of these limitations and use MACD in conjunction with other technical analysis tools for more accurate predictions.
Yes, there are several alternative indicators that traders can use alongside or instead of MACD. Some popular alternatives include the Relative Strength Index (RSI), Stochastic Oscillator, and Moving Average Envelopes. These indicators can provide different insights into the market and may be more suitable in certain trading strategies or market conditions. Traders should explore different indicators and find the ones that align with their trading style and goals.

Does Australia Have M2? Australia, known for its vast and diverse landscapes, is home to an extensive highway network that connects cities, towns, and …
Read Article
Historical Highs: The Price of Brent Oil Reaches New Heights The price of Brent oil has been making headlines recently as it continues to climb to …
Read Article
Is there a fee for currency conversion at Citibank? When it comes to banking and international transactions, one of the questions that often arises is …
Read Article
Understanding Binary Trading in the UK Binary trading has gained significant popularity in the UK in recent years, attracting both experienced …
Read Article
How much does the average scalper make? Scalping is a controversial practice where individuals buy tickets or merchandise at face value and then …
Read Article
Pros and Cons of Fixed and Flexible Exchange Rates: Which is Better? The choice between fixed and flexible exchange rates is a topic of great debate …
Read Article


