

Is it possible to start trading for free?
Start Trading for Free: Is It Possible? Trading has long been considered a lucrative way to generate income and build wealth. However, many people shy …
Read Article
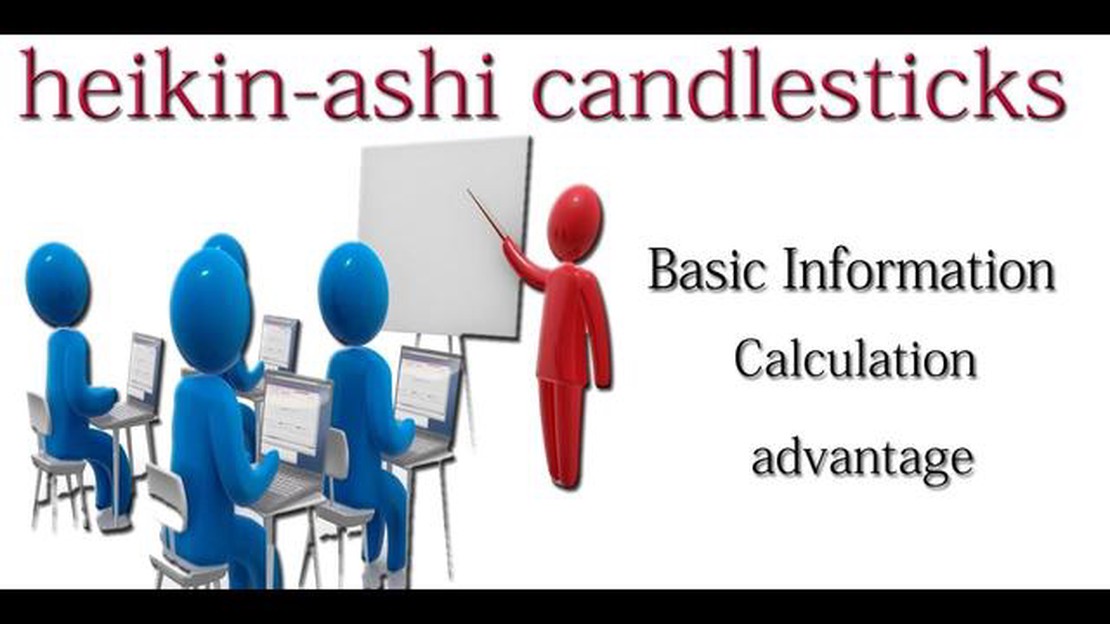
If you’re a trader looking to improve your technical analysis skills, understanding and calculating the Heikin Ashi candlestick chart can be a valuable tool. Heikin Ashi is a type of Japanese candlestick charting technique that helps smooth out market volatility and provide clearer trend signals. While it may seem complex at first, calculating Heikin Ashi in Excel can be easily done with a few simple formulas.
To start calculating Heikin Ashi in Excel, you’ll need the previous day’s close, open, high, and low price data as inputs. These can be obtained from various financial websites or data providers. Once you have these inputs, you can apply the following formulas to create the Heikin Ashi candlestick chart.
The first step is to calculate the average price, which is the average of the previous day’s open, close, high, and low prices. This can be done using the formula: (Open + Close + High + Low) / 4. The resulting average price will serve as the basis for calculating the Heikin Ashi open, close, high, and low values.
Next, you calculate the Heikin Ashi open and close values. The Heikin Ashi open is simply the average of the previous day’s open and close prices. The Heikin Ashi close is the average of the current day’s open, close, high, and low prices. These can be calculated using the formulas: (Previous Heikin Ashi Open + Previous Heikin Ashi Close) / 2 and (Open + Close + High + Low) / 4, respectively.
Finally, you calculate the Heikin Ashi high and low values. The Heikin Ashi high is the maximum value among the current day’s high, Heikin Ashi open, and Heikin Ashi close. The Heikin Ashi low is the minimum value among the current day’s low, Heikin Ashi open, and Heikin Ashi close. These can be calculated using the formulas: MAX(High, Heikin Ashi Open, Heikin Ashi Close) and MIN(Low, Heikin Ashi Open, Heikin Ashi Close), respectively.

By following these step-by-step instructions and using the provided formulas, you can easily calculate the Heikin Ashi candlestick chart in Excel. This can help you identify trends, improve your trading decisions, and ultimately enhance your overall trading strategy.
Heikin Ashi is a popular charting technique used in technical analysis to identify trends and potential reversals in the financial markets. It is based on candlestick charting principles but uses modified calculations to smooth out market noise and provide a clearer representation of price action.
The Heikin Ashi calculation involves four key elements: Open, Close, High, and Low. These elements are used to calculate the modified Open, Close, High, and Low values for each Heikin Ashi candlestick.
The modified Open value for a Heikin Ashi candlestick is calculated as the average of the previous candlestick’s Open and Close. This calculation helps to eliminate the gap between the previous candlestick’s Close and the current candlestick’s Open, providing a smoother representation of price movement.
The modified Close value for a Heikin Ashi candlestick is calculated as the average of the current candlestick’s Open, Close, High, and Low. This calculation helps to reduce the impact of extreme price movements and highlights the overall trend of the market.
Read Also: USD Currency Exchange in Bangalore Airport: Everything You Need to Know
The modified High value for a Heikin Ashi candlestick is the maximum of the current candlestick’s High, Open, or Close. This calculation helps to identify the highest point reached during the period and provides insight into the strength of the trend.
The modified Low value for a Heikin Ashi candlestick is the minimum of the current candlestick’s Low, Open, or Close. This calculation helps to identify the lowest point reached during the period and provides insight into the weakness of the trend.
Read Also: Does Azerbaijan have a fixed exchange rate?
To calculate Heikin Ashi in Excel, you can use a combination of formulas and functions to apply the modified calculations described above. By inputting the necessary data for each candlestick, you can generate a Heikin Ashi chart that provides a smoother representation of price action and helps to identify trends and potential reversals in the market.
| Original Candlestick | Heikin Ashi Candlestick |
|---|---|
| Open | =AVERAGE(Previous Close, Previous Open) |
| Close | =AVERAGE(Open, High, Low, Close) |
| High | =MAX(High, Open, Close) |
| Low | =MIN(Low, Open, Close) |
By following these basic principles of Heikin Ashi calculation in Excel, you can utilize this popular charting technique to analyze market trends and make more informed trading decisions.
In order to calculate Heikin Ashi in Excel, you will need to gather the necessary data, which includes the open, high, low, and close prices for a given period. This data can typically be obtained from financial websites, trading platforms, or other sources that provide historical price data.
Once you have obtained the data, you will need to organize it in a spreadsheet. Create columns for the date, open price, high price, low price, and close price. Enter the corresponding data for each period in the appropriate columns.

It is important to note that Heikin Ashi calculations are based on the previous period’s data, so it is necessary to have at least one period of historical data before you can start calculating Heikin Ashi values.
Heikin Ashi is a type of candlestick charting technique used in financial analysis. It is used to smooth out the price information and identify the current trend in the market.
Heikin Ashi charts use a special formula to calculate each candle’s open, close, high, and low prices. This results in smoother candlestick patterns compared to regular candlestick charts, making it easier to spot trends and reversals.
Heikin Ashi charts are useful for traders and investors as they provide a clearer picture of the market trend. They can help identify potential entry and exit points, as well as confirm or negate signals from other technical indicators.

Start Trading for Free: Is It Possible? Trading has long been considered a lucrative way to generate income and build wealth. However, many people shy …
Read Article
Exchange rate of 1 USD to 1 Birr The exchange rate between the US dollar (USD) and the Ethiopian birr (ETB) is an important factor for individuals and …
Read Article
International transfer process in IDBI Bank If you are looking to make an international money transfer, IDBI Bank provides a seamless and secure …
Read Article
Foreign Transaction Fee for Za Bank: Everything You Need to Know If you’re a frequent traveler or an expat living abroad, you may already be familiar …
Read Article
Trade Agreements of Japan: A Comprehensive Overview In recent years, Japan has emerged as one of the leading global players in international trade. …
Read Article
What is the best way to exchange money when Travelling? When traveling abroad, it is essential to have a plan for exchanging money. Finding the best …
Read Article


