


Discover the True Worth of Gold: How Much is Gold Actually Worth?
What is the current value of gold? Gold has always captivated humans with its timeless beauty and rarity. From ancient civilizations to modern times, …
Read Article
Investing in the stock market can be a daunting task, especially for novice traders. The sheer amount of information and the volatility of stock prices can make it difficult to determine which stocks are a good investment. However, by learning to read and understand chart patterns, traders can gain valuable insights into the strength and potential movement of a stock.
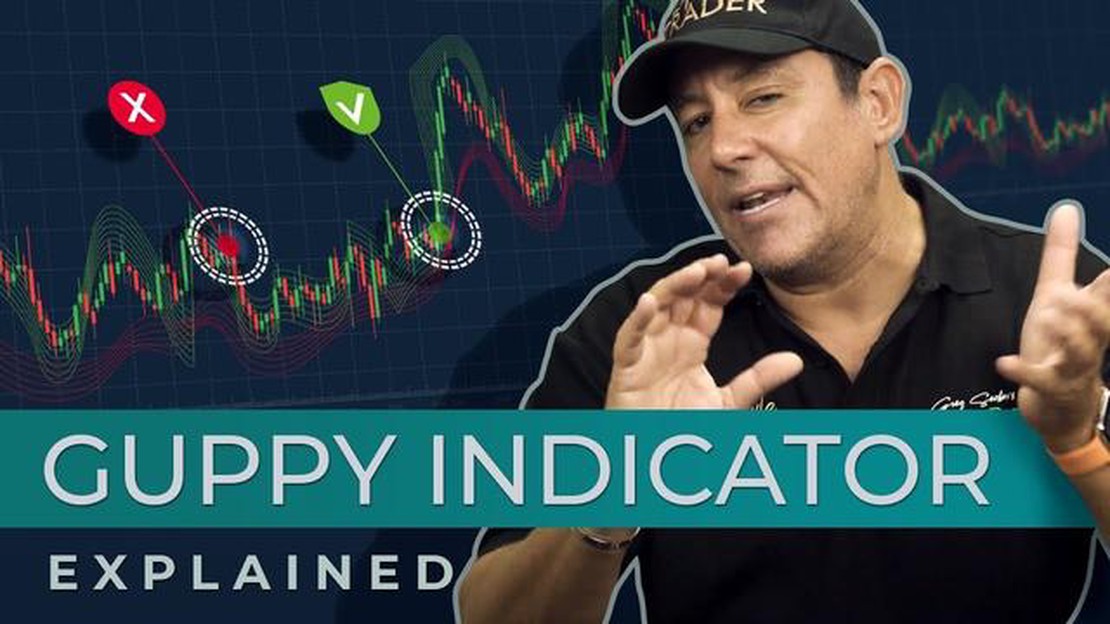
One chart pattern that is widely used by traders is the Guppy chart pattern. Developed by Australian trader Daryl Guppy, this pattern combines multiple moving averages to show the strength of a stock. By analyzing the interaction between these moving averages, traders can identify whether a stock is in an uptrend or a downtrend.
The Guppy chart pattern consists of two sets of moving averages: short-term and long-term. The short-term moving averages typically range from 3 to 15 periods, while the long-term moving averages range from 30 to 60 periods. When the short-term moving averages are above the long-term moving averages, it indicates that the stock is in an uptrend. Conversely, when the short-term moving averages are below the long-term moving averages, it indicates that the stock is in a downtrend.
In addition to determining the overall trend, the Guppy chart pattern can also help traders identify potential entry and exit points. When the short-term moving averages cross above the long-term moving averages, it is considered a buy signal. Likewise, when the short-term moving averages cross below the long-term moving averages, it is considered a sell signal.

By mastering the Guppy chart pattern, traders can gain a better understanding of stock strength and make more informed investment decisions. It is important to note that no chart pattern is foolproof, and traders should always use other indicators and perform thorough analysis before making any trading decisions. However, by incorporating the Guppy chart pattern into their trading strategy, traders can increase their chances of success in the stock market.
Overall, the Guppy chart pattern is a valuable tool for identifying stock strength and potential trading opportunities. By analyzing the interaction between short-term and long-term moving averages, traders can gain insight into the trend of a stock and make more informed investment decisions. While it is important to use other indicators and perform thorough analysis, the Guppy chart pattern can serve as a helpful guide for traders in navigating the complex world of the stock market.
Stock strength is an important concept for investors and traders to understand. It refers to the ability of a stock to maintain its price or rise in value, even in the face of market volatility. Stocks with strong strength tend to perform well and may be considered good investment opportunities.
Read Also: Understanding the Logic of Option Trading: A Complete Guide
There are several factors that contribute to stock strength. One key factor is the company’s financial health and profitability. Stocks of companies with positive earnings growth and solid financials are more likely to have strong strength. Additionally, strong stock strength can also be influenced by market trends, investor sentiment, and industry performance.
Chart patterns can also provide insights into stock strength. For instance, the Guppy chart patterns are a popular tool used by technical analysts to identify potential stock strength. These patterns involve a combination of moving averages and can indicate when a stock is gaining or losing strength.
| Pattern | Description |
|---|---|
| Guppy Multiple Moving Average (GMMA) | GMMA consists of two sets of exponential moving averages (EMAs), one short-term and one long-term. When the short-term EMAs cross above the long-term EMAs, it can indicate a bullish signal and potential stock strength. |
| Guppy Multiple Moving Average Divergence (GMMA Divergence) | GMMA Divergence occurs when the short-term EMAs and long-term EMAs start to diverge, indicating a potential loss of stock strength. |
| Guppy Multiple Moving Average Compression (GMMA Compression) | GMMA Compression happens when the short-term EMAs and long-term EMAs converge, suggesting a consolidation phase and potential breakout in stock strength. |
By understanding stock strength and utilizing tools like Guppy chart patterns, investors and traders can make more informed decisions and potentially find profitable investment opportunities.
Guppy chart patterns, developed by Daryl Guppy, are used by traders to identify the strength and potential direction of a stock. These patterns are based on the concept of multiple moving averages and can provide valuable insights into the market sentiment.
One of the key Guppy chart patterns is the “Guppy Multiple Moving Average” (GMMA). This pattern consists of two groups of moving averages – one short-term group and one long-term group. The short-term moving averages represent the buying pressure in the market, while the long-term moving averages represent the selling pressure. Traders often look for convergence or divergence between these two groups to determine whether the stock is gaining strength or losing momentum.
Another important Guppy chart pattern is the “Guppy Multiple Moving Average Ribbon” (GMMAR). This pattern involves plotting multiple moving averages of different time periods on the same chart, creating a ribbon-like pattern. The ribbon provides visual cues about the stock’s trend and the strength of the underlying momentum. When the ribbon is wide and expanding, it indicates a strong trend, while a narrow and contracting ribbon suggests a weakening trend.
Traders also pay attention to the “Guppy Maximum Time Segmented Volume” (GM-TSV) indicator, which is used to identify periods of accumulation or distribution in the stock. This indicator measures the volume traded at different price levels and can help traders spot potential reversals or breakouts.
Read Also: Opening a Foreign Currency Account in Maybank: Everything You Need to Know
| Guppy Chart Pattern | Description |
|---|---|
| Guppy Multiple Moving Average (GMMA) | Consists of short-term and long-term moving averages to identify buying and selling pressure. |
| Guppy Multiple Moving Average Ribbon (GMMAR) | Plots multiple moving averages of different time periods to visualize the stock’s trend and momentum. |
| Guppy Maximum Time Segmented Volume (GM-TSV) | Measures volume traded at different price levels to identify accumulation or distribution periods. |
By decoding Guppy chart patterns, traders can gain a deeper understanding of the market dynamics and make more informed trading decisions. These patterns provide valuable insights into the strength and direction of a stock, helping traders navigate volatile markets with confidence.
Guppy chart patterns are visual indicators that help identify the strength and direction of a stock’s trend. These patterns use a combination of moving averages to provide insights into the market sentiment.

Guppy chart patterns are used in stock analysis to determine the overall trend of a stock, as well as possible entry and exit points. By analyzing the interaction of different moving averages, traders can gain insight into the strength and direction of the market.
Guppy chart patterns use a combination of short-term, medium-term, and long-term moving averages. The short-term moving averages, such as the 3-day or 5-day moving averages, provide insights into short-term trends. The medium-term moving averages, such as the 20-day or 50-day moving averages, help identify medium-term trends. The long-term moving averages, such as the 100-day or 200-day moving averages, reveal long-term trends.
Yes, Guppy chart patterns can be used for day trading. By analyzing the shorter-term moving averages, traders can identify short-term trends and make trading decisions accordingly. However, it’s important to note that Guppy chart patterns should be used in conjunction with other indicators and analysis tools to increase the accuracy of trading decisions.

What is the current value of gold? Gold has always captivated humans with its timeless beauty and rarity. From ancient civilizations to modern times, …
Read Article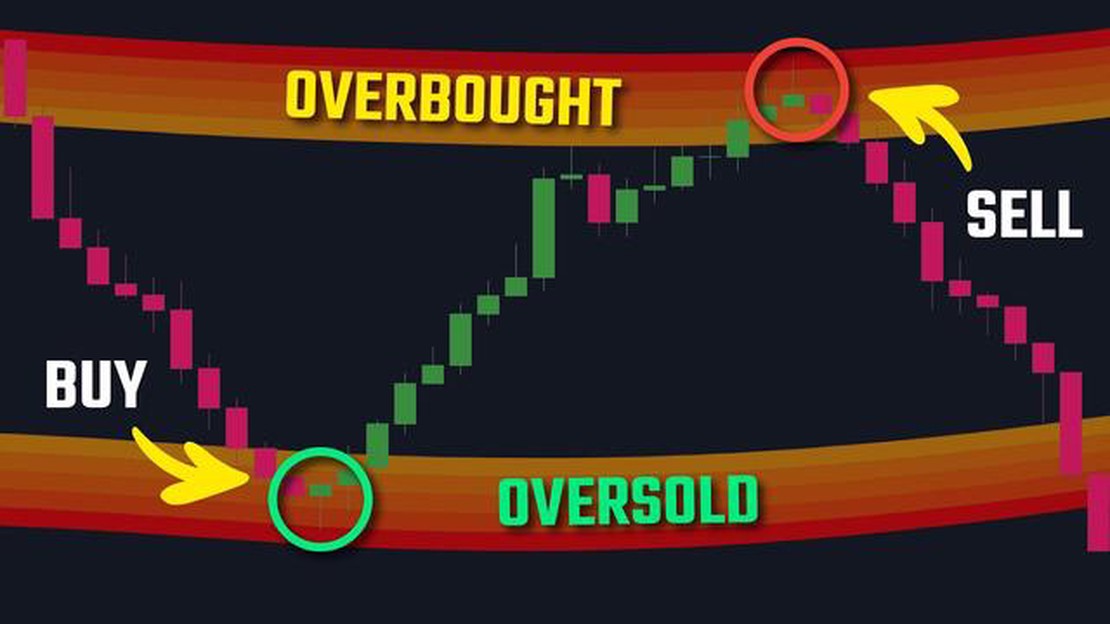
Is Overbought Oversold a Signal to Buy or Sell? When it comes to investing in the financial markets, one of the key factors to consider is the concept …
Read Article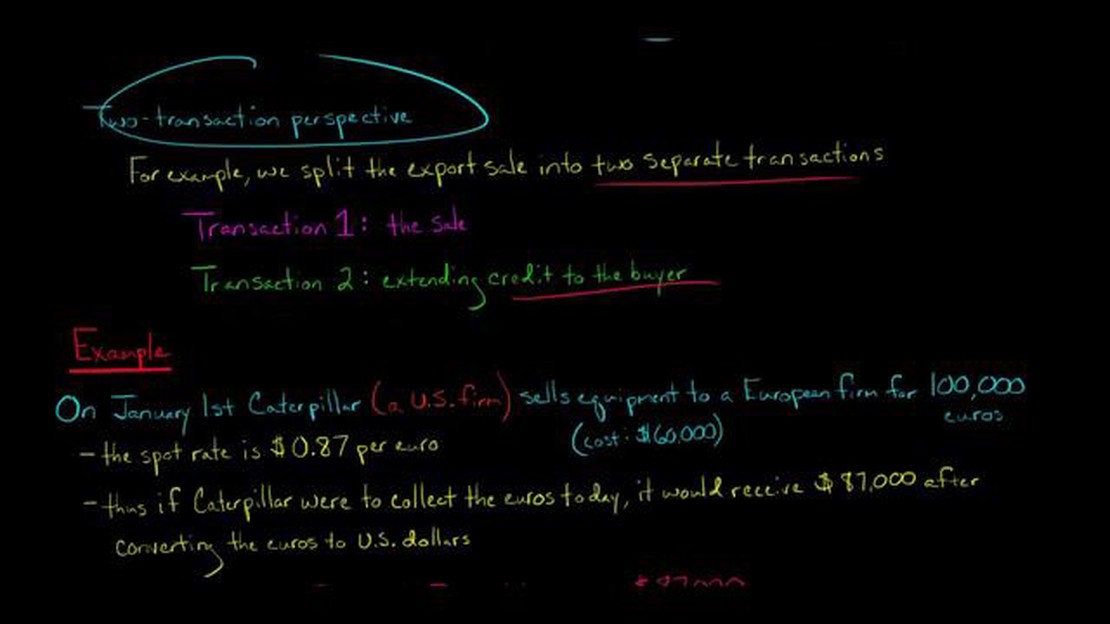
Where to report foreign exchange gain or loss on income statement? Foreign exchange gains or losses can have a significant impact on a company’s …
Read Article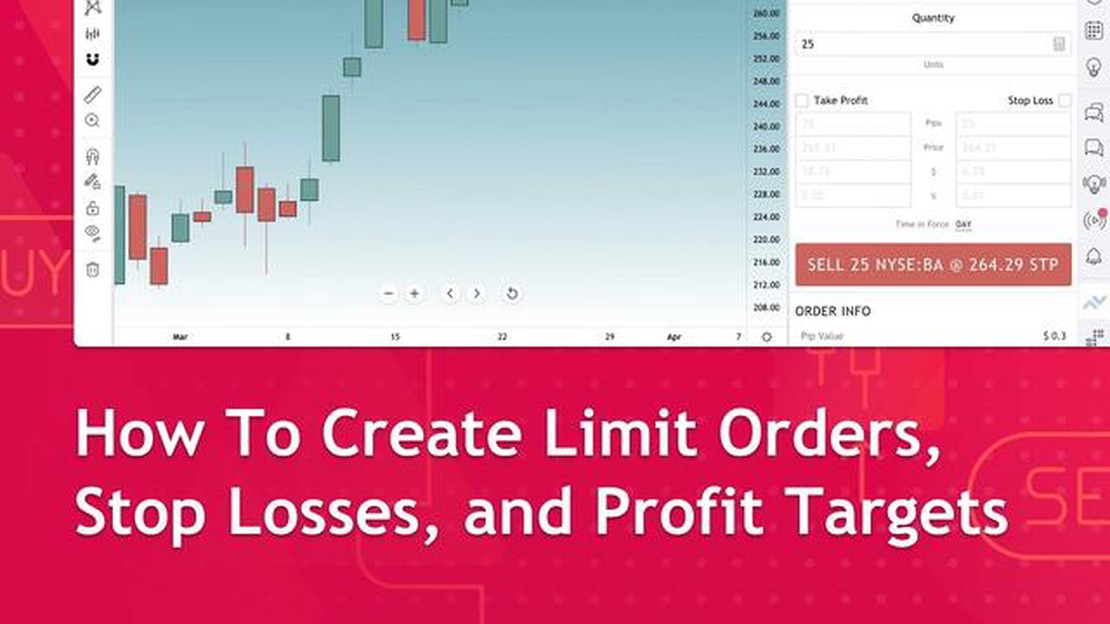
How to Make Profit with a Limit Order When it comes to trading in the financial markets, one of the most important tools in a trader’s arsenal is the …
Read Article
Understanding EU in Forex Market The European Union (EU) plays a crucial role in the global economy and has a significant impact on the forex market. …
Read Article
Top 10 Best Binary Traders in the World When it comes to binary trading, finding the right traders to follow can make all the difference in your …
Read Article


