


How to Achieve a 10% Return on Investment: Expert Tips and Strategies
How to Achieve a 10% Return on Investment When it comes to investing, everyone wants to get the highest return possible. Whether you’re a seasoned …
Read Article
When it comes to investing in the financial markets, one of the key factors to consider is the concept of overbought and oversold indicators. These indicators are used to assess the momentum and strength of a particular asset or market, and can help investors determine whether it is a good time to buy or sell. Understanding how these indicators work and how to interpret them is crucial for successful trading.
An overbought indicator is a signal that a particular asset or market has been pushed to a point where it may be due for a price correction. This could be due to a number of factors, such as excessive buying pressure or a sudden surge in demand. When an asset is deemed overbought, it may be an indication that it is trading at a higher price than its true value, and may therefore be at risk of a price decline. This is typically seen as a bearish signal, and investors may consider selling their positions to take profits or avoid potential losses.
On the other hand, an oversold indicator suggests that a particular asset or market has been pushed to a point where it may be due for a price rebound. This could be due to a number of factors, such as excessive selling pressure or a sudden drop in demand. When an asset is deemed oversold, it may be an indication that it is trading at a lower price than its true value, and may therefore be at risk of a price increase. This is typically seen as a bullish signal, and investors may consider buying the asset at a discounted price in anticipation of a price rally.
It’s important to note that overbought and oversold indicators should not be used in isolation. They should be used in conjunction with other technical analysis tools and indicators to confirm trading signals and enhance the accuracy of decision-making. Additionally, it’s vital to consider the overall market conditions and trends, as well as any relevant news or events that may impact the asset or market in question. By taking a comprehensive approach to analyzing overbought and oversold indicators, investors can make more informed decisions and improve their overall trading performance.
In conclusion, understanding overbought and oversold indicators is essential for investors looking to navigate the financial markets. These indicators provide valuable insights into the momentum and strength of an asset or market, and can help investors determine whether it is a good time to buy or sell. However, it’s important to use these indicators in conjunction with other technical analysis tools and consider the broader market conditions for a more comprehensive assessment. By doing so, investors can make more informed decisions and increase their chances of success.
The concept of overbought and oversold indicators is a fundamental aspect of technical analysis in financial markets. These indicators help traders and investors identify potential turning points in the market and make informed decisions about buying or selling assets.

Overbought and oversold indicators are based on the premise that market prices tend to fluctuate within a range. When prices move too far away from this range, it is believed that the market is overbought or oversold, indicating a potential reversal in the near future.
An overbought condition occurs when the price of an asset rises too quickly and reaches a level that is higher than its intrinsic value. This can happen due to excessive buying pressure, speculation, or market sentiment. When a market is overbought, it suggests that the demand for the asset has become too high, and a correction may be imminent.
On the other hand, an oversold condition happens when the price of an asset falls too quickly and reaches a level that is lower than its intrinsic value. Oversold conditions can occur when there is excessive selling pressure, panic selling, or negative market sentiment. When a market is oversold, it suggests that the supply of the asset has become too high, and a potential rebound may be on the horizon.
Traders and investors use various indicators to identify overbought and oversold conditions. Some common indicators include the Relative Strength Index (RSI), Stochastic Oscillator, and Moving Average Convergence Divergence (MACD). These indicators measure the momentum and strength of price movements, helping traders determine when to buy or sell an asset.
Read Also: What is the minimum fund for forex? A comprehensive guide
It is important to note that overbought and oversold indicators are not foolproof signals, and they should be used in conjunction with other technical analysis tools and market information. While these indicators can provide valuable insights into market conditions, they are not guarantees of future price movements. Traders and investors should exercise caution and perform thorough analysis before making any trading decisions based on overbought and oversold indicators.
In conclusion, overbought and oversold indicators are essential tools for traders and investors to understand market conditions. By identifying potential turning points in the market, these indicators can help guide buying and selling decisions. However, they should not be relied upon solely and should be used as part of a comprehensive analysis strategy.
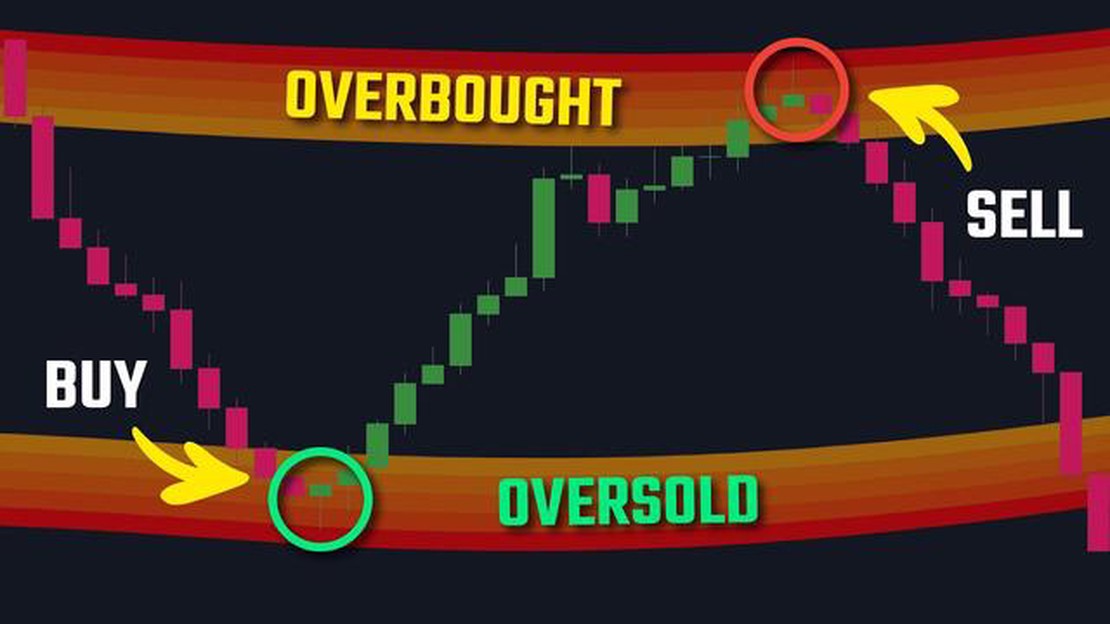
Overbought and oversold indicators are tools used in technical analysis to identify potential turning points in the price of a security or market. They are based on the premise that when a security or market is overbought, it may be due for a price correction or reversal to the downside. Conversely, when a security or market is oversold, it may be due for a price correction or reversal to the upside.
Overbought and oversold indicators use various calculations, such as momentum or oscillators, to determine the current state of a security or market. These indicators typically provide numerical values that range from 0 to 100, with values above 70 indicating overbought conditions and values below 30 indicating oversold conditions. However, the specific thresholds may vary depending on the indicator being used.
Read Also: Exercising VIX Options: A Step-by-Step Guide to Unlocking Their Potential
When a security or market is deemed overbought, it means that buying pressure has pushed the price to a level that may not be sustainable in the short term. Traders and investors may interpret this as a signal to sell or take profits. Conversely, when a security or market is deemed oversold, it means that selling pressure has pushed the price to a level that may not be sustainable in the short term. Traders and investors may interpret this as a signal to buy or enter a long position.
It’s important to note that overbought and oversold indicators are not foolproof and should not be used in isolation. They are just one tool among many in a trader or investor’s toolbox. It’s also important to consider other factors, such as trend analysis, volume patterns, and fundamental analysis, before making any trading decisions based on these indicators.
Overall, overbought and oversold indicators can be helpful in identifying potential reversal points in the price of a security or market. However, they should be used in conjunction with other technical analysis tools and should not be relied upon as the sole basis for making trading decisions.
Overbought and oversold indicators are technical analysis tools used by traders to determine when an asset’s price may have become overextended in one direction. Overbought indicators suggest that the price has risen too far, too fast and may be due for a correction or reversal, while oversold indicators suggest that the price has fallen too far, too fast and may be due for a bounce or rebound.

Traders use overbought and oversold indicators as signals to initiate trades or manage existing positions. When an asset becomes overbought, traders may consider selling or shorting the asset, anticipating a potential decline in price. Conversely, when an asset becomes oversold, traders may consider buying or going long on the asset, expecting a potential increase in price.
Some commonly used overbought indicators include the Relative Strength Index (RSI), the Stochastic Oscillator, and the Williams %R. These indicators calculate and compare recent price gains and losses, providing a numerical value that indicates the strength and direction of the price trend. When these indicators climb above a certain threshold, such as 70 or 80, it suggests that the asset may be overbought.
Some commonly used oversold indicators include the Relative Strength Index (RSI), the Stochastic Oscillator, and the Williams %R. These indicators calculate and compare recent price gains and losses, providing a numerical value that indicates the strength and direction of the price trend. When these indicators drop below a certain threshold, such as 30 or 20, it suggests that the asset may be oversold.
No, relying solely on overbought and oversold indicators may not be sufficient to make trading decisions. It is important to use these indicators in conjunction with other technical analysis tools and factors such as trend analysis, support and resistance levels, and market sentiment. Overbought and oversold indicators should be used as part of a comprehensive trading strategy to increase the probability of successful trades.
When an indicator is overbought, it means that the price of the asset has risen to a level that is considered too high, and a reversal or pullback in price may be imminent. Conversely, when an indicator is oversold, it means that the price of the asset has fallen to a level that is considered too low, and a reversal or bounce in price may be imminent. Overbought and oversold indicators are common tools used by traders to help identify potential buying or selling opportunities.

How to Achieve a 10% Return on Investment When it comes to investing, everyone wants to get the highest return possible. Whether you’re a seasoned …
Read Article
Is exponential moving average better? An exponential moving average (EMA) is a type of moving average that is commonly used in technical analysis to …
Read Article
Is It Possible to Trade Forex on IG? If you’re interested in trading forex, you’ve probably heard of IG. But can you trade forex on IG? The answer is …
Read Article
USD JPY: Is the Currency Pair Going Down? The USD JPY currency pair has seen some significant fluctuations in recent months, leaving many investors …
Read Article
Trading QQQ Options: The Best Times to Trade Trading options on the QQQ, an exchange-traded fund (ETF) that tracks the performance of the Nasdaq 100 …
Read Article
What is the full name of forex trading? Forex trading, also known as foreign exchange trading, is the buying and selling of currencies on the global …
Read Article


