


What is PVC board made of? Discover the Composition of PVC Boards
What is PVC board made of? PVC (Polyvinyl Chloride) board is a versatile material used in various industries for a wide range of applications. It is a …
Read Article

Bollinger Bands are a technical analysis tool that was developed by John Bollinger in the 1980s. They are widely used by traders to identify potential trading opportunities and to analyze market volatility.
The bands consist of a simple moving average (SMA) line, which is typically set at 20 periods, and two standard deviation lines that are positioned above and below the SMA line. The distance between the upper and lower bands is an indication of market volatility, with wider bands indicating higher volatility and narrower bands indicating lower volatility.
Traders can use Bollinger Bands in various ways to make trading decisions. One common strategy is to look for price action to touch or pierce the upper or lower band, which can signal a potential reversal or a continuation of a trend. Another approach is to look for price to move outside of the bands and then re-enter, which can suggest a potential breakout.
Bollinger Bands can also be used in conjunction with other technical indicators to confirm signals and increase the probability of successful trades. For example, traders may use Bollinger Bands in combination with a stochastic oscillator to identify overbought or oversold conditions in the market.
Overall, Bollinger Bands provide traders with a visual representation of market volatility and can be a valuable tool in identifying potential trading opportunities. However, like any technical analysis tool, they are not foolproof and should be used in conjunction with other forms of analysis and risk management techniques.
If you are new to trading and looking to improve your understanding of technical analysis, Bollinger Bands can be a great tool to add to your toolkit. Bollinger Bands are a popular technical indicator that can help identify price volatility and potential trading opportunities.
Developed by John Bollinger in the 1980s, Bollinger Bands consist of three lines on a price chart: the middle band, the upper band, and the lower band. The middle band is typically a simple moving average, and the upper and lower bands are calculated by adding and subtracting a certain number of standard deviations from the middle band.
The middle band reflects the average price over a given period, while the upper and lower bands provide a measure of price volatility. When price moves towards the upper band, it suggests that the market is overbought, and when price moves towards the lower band, it suggests that the market is oversold. Traders often look for price reversals or trading opportunities when price reaches these bands.
Bollinger Bands can also help traders identify periods of low volatility, known as “Bollinger Squeeze.” During a squeeze, the upper and lower bands come close together, indicating a potential breakout or significant price move. Traders can use this information to anticipate a possible increase in price volatility and position themselves accordingly.

While Bollinger Bands have proven to be a useful tool for many traders, it is important to note that they should not be used in isolation. They work best when used in conjunction with other indicators and analysis techniques to confirm trading signals and reduce false signals.
It is also essential to consider other factors such as market trends, support and resistance levels, and overall market conditions when using Bollinger Bands. They are just one piece of the puzzle in a comprehensive trading strategy.
In conclusion, Bollinger Bands are a valuable technical analysis tool that can help traders identify price volatility and potential trading opportunities. By understanding how they work and incorporating them into a broader trading strategy, beginners can enhance their trading decisions and improve their overall trading performance.
Bollinger Bands are a technical analysis tool that helps traders analyze market volatility and potential price trends. They were developed by John Bollinger in the 1980s and have since become a popular tool for both novice and experienced traders.
Bollinger Bands consist of three lines: a middle line that represents the moving average of the asset’s price, and two outer bands that are placed a certain number of standard deviations away from the middle line. The distance between the outer bands is determined by market volatility.
Read Also: How to Quote FX Pairs: A Comprehensive Guide
These bands provide valuable information about the volatility and potential price movement of an asset. When the price is trading near the upper band, it may indicate that the asset is overbought, and a reversal or correction could be imminent. Conversely, when the price is trading near the lower band, it may indicate that the asset is oversold, and a potential rebound or upward movement could be expected.
Traders can also look for patterns or signals within the Bollinger Bands to enter or exit trades. For example, a contraction in the width of the bands may indicate low volatility and could precede a significant price breakout. Likewise, a touch of the upper or lower band followed by a reversal in price direction may signal a potential trading opportunity.
It is important to note that Bollinger Bands should not be used in isolation and should be used in conjunction with other technical analysis tools and indicators. They are best used as a complement to existing trading strategies and can help traders make more informed decisions.
In conclusion, Bollinger Bands are a versatile and popular tool for analyzing market volatility and potential price trends. By understanding how they work and using them in conjunction with other indicators, traders can gain valuable insights into market conditions and make more effective trading decisions.
Read Also: Learn the basics of the dividend option trading strategy
Bollinger Bands, a popular technical analysis tool developed by John Bollinger, can be utilized to identify trends and measure price volatility in financial markets.
Bollinger Bands consist of three lines: the middle band, which is a simple moving average (typically set at 20 periods), and an upper and lower band, which are plotted above and below the middle band. The upper and lower bands are typically set two standard deviations away from the middle band.
When prices are trading within the range of the middle band, it is an indication that the market is in a period of consolidation or a sideways trend. Traders can look for potential breakout opportunities when the price moves outside of this range.
When the price reaches the upper band, it suggests that the market is overbought and may be due for a reversal or a pullback. Conversely, when the price reaches the lower band, it indicates that the market is oversold and may be poised for a bounce or a rally.
The width of the Bollinger Bands can also provide insights into price volatility. During periods of high volatility, the bands will widen, indicating that price swings are larger and more unpredictable. During periods of low volatility, the bands will narrow, suggesting that price movements are smaller and more subdued.

Traders can use Bollinger Bands in conjunction with other technical analysis tools to confirm trends and price reversals. For example, a trader may look for a bullish crossover (when the price moves above the upper band) accompanied by a bullish candlestick pattern and positive momentum indicators to enter a long position.
Similarly, a bearish crossover (when the price moves below the lower band) combined with a bearish candlestick pattern and negative momentum indicators could be taken as a signal to enter a short position.
In conclusion, Bollinger Bands can be a valuable tool for traders to identify trends and measure price volatility in the financial markets. By understanding the different signals and patterns that the Bollinger Bands provide, traders can make more informed decisions and improve their trading strategies.
Bollinger Bands are a technical analysis tool that consists of a moving average line in the middle and two standard deviation bands above and below it.
Bollinger Bands are used to identify periods of high or low volatility in a market. Traders use them to determine when a price is overbought or oversold, and when a reversal or a breakout may occur.
When the price touches the upper Bollinger Band, it suggests that the market is in an overbought condition, and a reversal or a downward movement may occur.
When the price touches the lower Bollinger Band, it suggests that the market is in an oversold condition, and a reversal or an upward movement may occur.
While Bollinger Bands can be used as a standalone indicator, it is recommended to use them in combination with other technical analysis tools to confirm trading signals.

What is PVC board made of? PVC (Polyvinyl Chloride) board is a versatile material used in various industries for a wide range of applications. It is a …
Read Article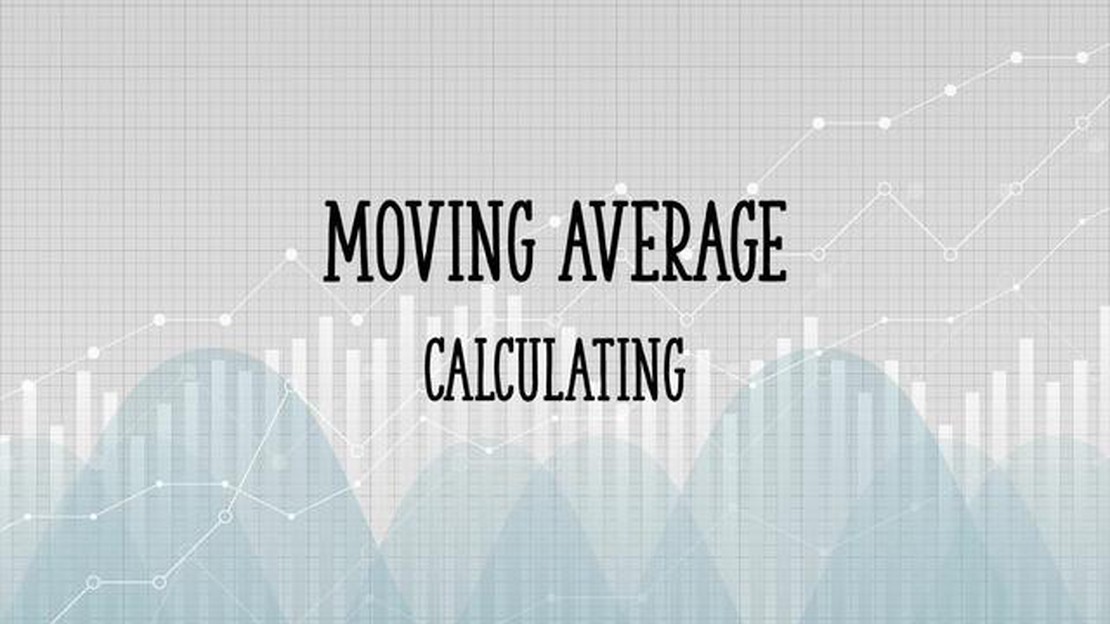
How to Calculate a 5 Period Moving Average Introduction Table Of Contents Step-by-Step Guide to Calculate the 5 Period Moving Average FAQ: Why is it …
Read Article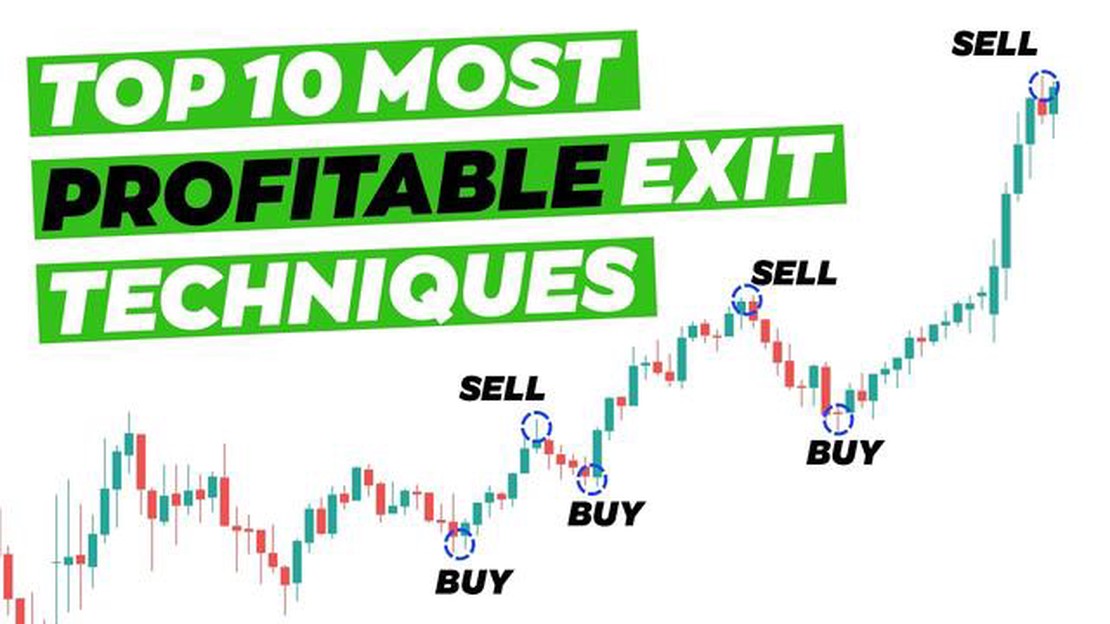
Methods for Recording Trades: A Comprehensive Guide When it comes to trading, keeping a record of your trades is essential for a variety of reasons. …
Read Article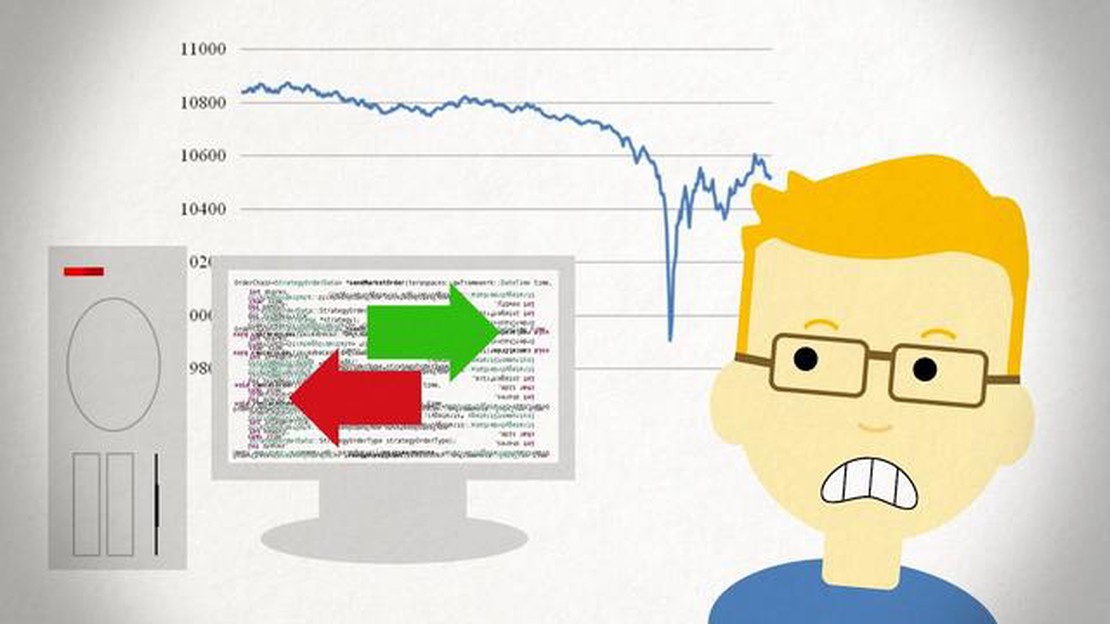
What is the role of high-frequency traders in the FX market? High-frequency traders (HFTs) have had a significant impact on the foreign exchange (FX) …
Read Article
Discover the Truth: Do Expert Advisors Really Work? Automated trading systems have become increasingly popular in the financial world, promising to …
Read Article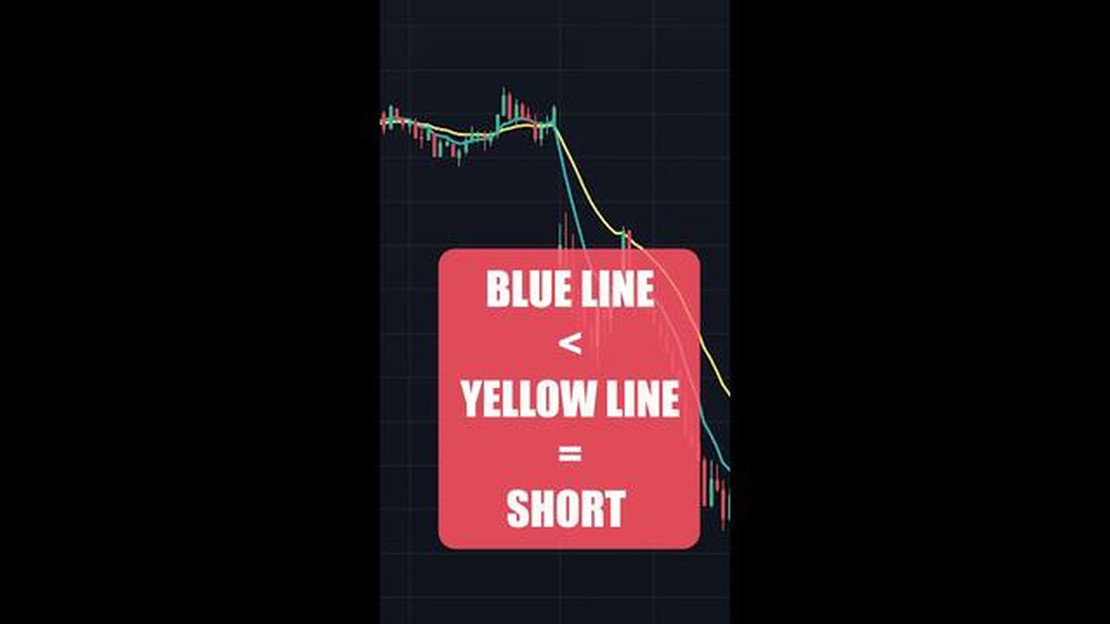
Exploring the 25 EMA Strategy: A Guide for Traders When it comes to trading, having a reliable strategy can make all the difference. One popular …
Read Article


