


Discover the Top Affiliate Program in the World
What is the Best Affiliate Program in the World? Are you looking to make money online and own your own business? Look no further than the top …
Read Article
Trends come and go, and if you want to stay ahead in any industry, it’s crucial to be able to spot when a trend is nearing its end. Whether you’re a trader, investor, or just a keen observer, understanding the signs of a trend reversal can help you avoid losses or make profitable decisions. In this article, we will explore some essential tips and strategies to help you identify the end of a trend.
One of the key indicators of an upcoming trend reversal is a change in market sentiment. When people start to lose interest or confidence in a particular trend, it often signifies its end. Pay attention to social media discussions, news articles, and expert opinions to get a sense of whether the sentiment is shifting. Look for signs of skepticism or growing doubts, as these can be early warnings of an approaching trend reversal.
Another effective way to spot the end of a trend is by analyzing price patterns and technical indicators. Look for trendlines that are being broken or weakening, as this can signal a shift in market dynamics. Pay attention to moving averages, candlestick patterns, and volume indicators to get a clearer picture of the market’s trend. These technical tools can provide valuable insights into when a trend is losing momentum and likely to reverse.
Furthermore, keeping an eye on the fundamentals of the industry or market can also help you predict the end of a trend. Look for signs of saturation, regulatory changes, or technological advancements that may disrupt the current trend. Fundamentals can often drive the long-term direction of a market, so staying informed about industry news and developments is crucial for identifying when a trend is about to end.
In conclusion, being able to spot the end of a trend is an essential skill for anyone involved in trading, investing, or simply staying informed about the market. By paying attention to market sentiment, analyzing price patterns and technical indicators, and keeping an eye on industry fundamentals, you can improve your ability to identify the signs of a trend reversal. Remember, trends may come and go, but being able to adapt and recognize when a trend is ending can help you stay ahead in any industry.
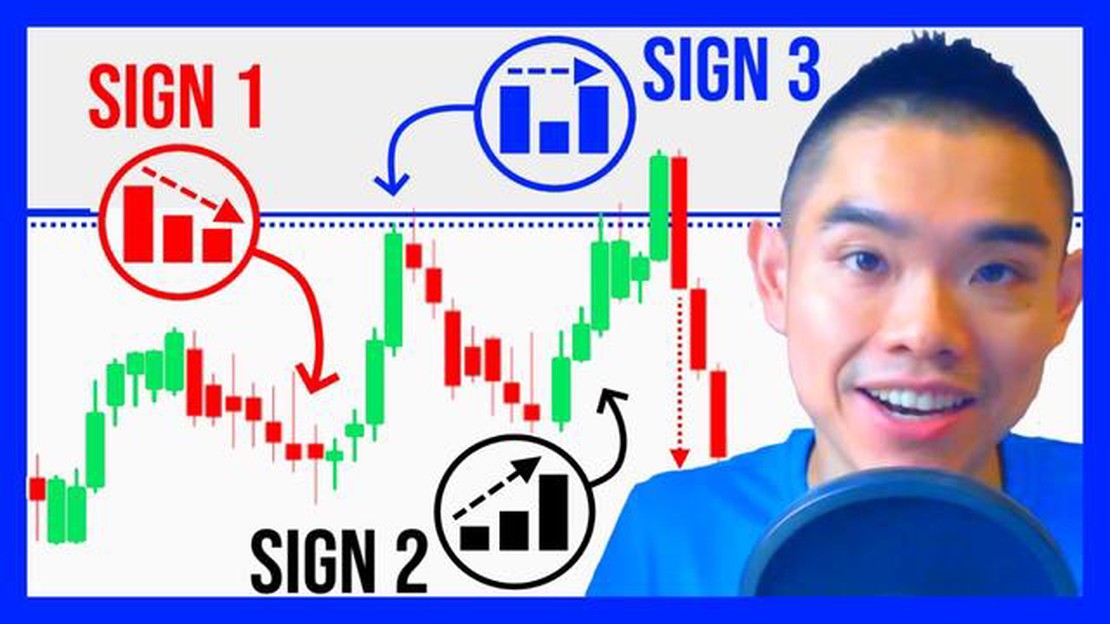
Recognizing the early signs of the end of a trend can help traders and investors minimize losses and maximize profits. Here are some essential tips and strategies to help you spot the signs of an impending trend reversal:
| Sign | Description |
|---|---|
| 1. Decreasing volume: | Watch for a decrease in trading volume, as it may indicate that market participants are losing interest and the trend is weakening. |
| 2. Lower highs and lower lows: | If you notice a series of lower highs and lower lows in an uptrend or higher lows and higher highs in a downtrend, it could be a sign that the trend is about to reverse. |
| 3. Divergence: | Pay attention to any divergence between price and technical indicators, such as oscillators or moving averages. Divergence occurs when the price makes a higher high or lower low, but the indicator fails to confirm it. |
| 4. Break of support or resistance: | A significant break of a key support or resistance level can signal a trend reversal. Look for strong volume and price action confirmation when this occurs. |
| 5. Trendline break: | When a trendline is broken, it can indicate a potential trend reversal. Monitor for a decisive break with volume confirmation. |
| 6. Overbought or oversold conditions: | Extreme overbought or oversold conditions on technical indicators such as the Relative Strength Index (RSI) or Stochastic Oscillator can suggest that a trend is nearing its end. |
| 7. Fundamental changes: | Keep an eye on any fundamental changes that could impact the underlying asset or market. News events, economic data, or geopolitical developments can all influence trends. |

It’s important to note that spotting early signs of a trend reversal does not guarantee accurate predictions. It’s always advisable to use these indicators and strategies in conjunction with other technical and fundamental analysis tools to make informed trading decisions.
When trying to spot the end of a trend, analyzing market data is crucial. By examining historical data and current market conditions, you can gather valuable insights that can help you identify the signs of a trend change.
Read Also: Why is My Day Trading Buying Power So Low? Exploring the Reasons Behind Low Trading Power
One important aspect of analyzing market data is studying price movements. Looking at the price charts can give you a clear picture of how the market has been behaving. Pay attention to any patterns or trends that have emerged over time. Take note of any significant highs or lows, as these can indicate potential turning points.
Another useful tool in analyzing market data is technical analysis. By using indicators and oscillators, you can identify potential reversals or trend exhaustion. Look for signals such as divergences, moving average crossovers, or overbought/oversold conditions. These can provide valuable information about the strength of a trend and its potential to reverse.
Additionally, it’s essential to consider fundamental factors that may influence the market. Economic data, news events, and geopolitical developments can all have an impact on market trends. Stay updated on relevant news and announcements that may affect the assets you are trading. By understanding the underlying fundamentals, you can anticipate potential shifts in the market sentiment.
Lastly, sentiment analysis can help you gauge market expectations and investor sentiment. Pay attention to market sentiment indicators, such as the CBOE Volatility Index (VIX) or the put/call ratio. These can give you an idea of whether the market is overly optimistic or pessimistic, which can be a sign of a potential trend reversal.
Remember, analyzing market data requires a comprehensive approach. By combining technical and fundamental analysis with sentiment analysis, you can increase your chances of identifying the end of a trend.
When you spot the end of a trend, it’s important to adapt your strategy to avoid losses and take advantage of new opportunities. Here are some essential tips to help you adapt:
Read Also: Choosing the Best Trading Room for Forex: Expert Recommendations and Analysis
Adapting your strategy is crucial to staying ahead in the markets. By being proactive and flexible, you can mitigate risks and capitalize on new opportunities.
Some essential tips for spotting the end of a trend include keeping an eye on key indicators, such as volume and momentum, looking for signs of divergence, and monitoring the overall market sentiment.

You can use volume and momentum indicators to spot the end of a trend by looking for a decrease in volume and a loss of momentum. If the volume starts to decrease while the price continues to move in the same direction, it could be a sign that the trend is losing steam.
Divergence refers to a situation where the price of an asset moves in the opposite direction of a technical indicator. This can indicate a potential trend reversal. For example, if the price is making higher highs while a momentum indicator is making lower highs, it could be a sign that the trend is coming to an end.
Monitoring market sentiment is important for spotting the end of a trend because it can help you gauge the overall mood of investors and traders. If the market sentiment suddenly shifts from bullish to bearish, it could be an indication that the trend is about to reverse.
Yes, there are other strategies for spotting the end of a trend. These include analyzing chart patterns, using trend lines, and keeping an eye on key support and resistance levels. By combining these strategies with the essential tips mentioned earlier, you can increase your chances of accurately identifying the end of a trend.
There are several indicators that can signal the end of a trend. One of the most common signs is a decrease in momentum or volume, indicating that fewer traders are participating in the trend. Another indicator is a divergence between the price and a momentum oscillator, such as the relative strength index (RSI) or moving average convergence divergence (MACD). Additionally, a trendline break or a pattern reversal on a chart can also suggest that a trend is ending.
Yes, there are strategies that can assist in identifying the end of a trend. One approach is to use a combination of technical indicators, such as moving averages and oscillators, to look for signs of a trend reversal. For example, when the price moves below a certain moving average or when a momentum oscillator crosses over a certain level, it may indicate that the trend is ending. Another strategy is to monitor the price action and volume to identify any patterns or changes in behavior that may suggest a trend is coming to an end.

What is the Best Affiliate Program in the World? Are you looking to make money online and own your own business? Look no further than the top …
Read Article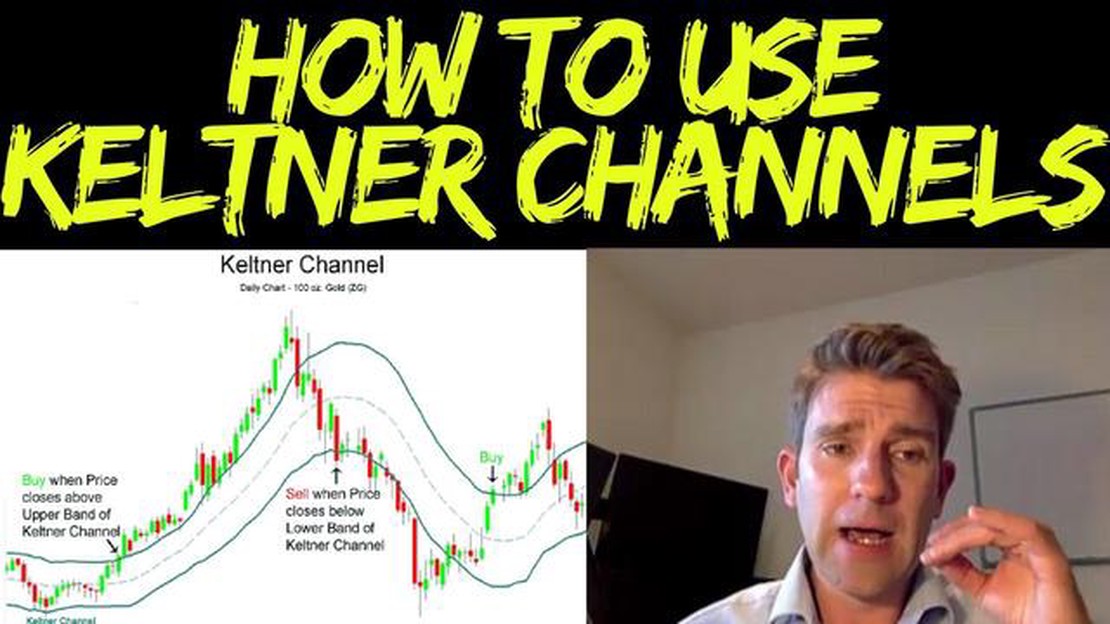
Comparison of Bollinger Bands and Keltner Channels Introduction: When it comes to technical analysis in the world of trading, Bollinger Bands and …
Read Article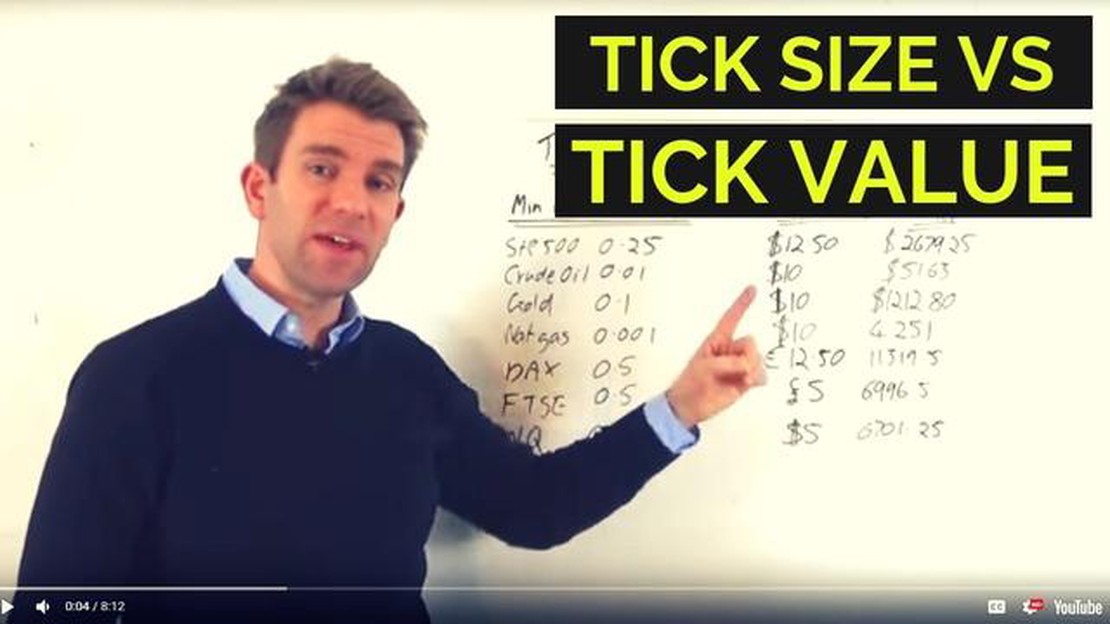
Understanding the Tick Size in Forex Trading When it comes to trading in the foreign exchange market, understanding the tick size is crucial. The tick …
Read Article
How to Solve Moving Average Problems Understanding moving averages is a crucial skill for any data analyst or trader. However, many individuals …
Read Article
Is option trading halal in India? Islamic finance is a growing field that seeks to align financial transactions with the principles and teachings of …
Read Article
Can I use OANDA in Netherlands? If you are based in the Netherlands and interested in using OANDA for your forex trading needs, you’ll be pleased to …
Read Article


