
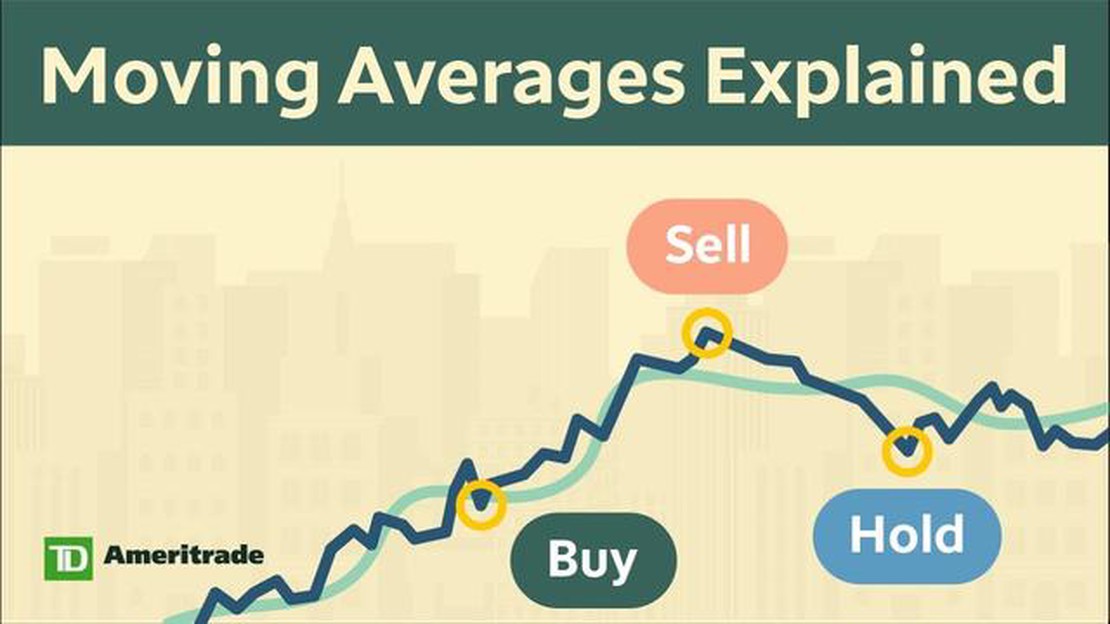

Unlocking Insights: Decoding the Moving Average
Understanding the Insights of Moving Average Analysis When it comes to analyzing financial data, one of the most commonly used tools is the moving …
Read Article
Introduction:
When it comes to technical analysis in the world of trading, Bollinger Bands and Keltner Channels are two popular indicators that traders often use to identify potential trends and reversal points in the market. While both indicators serve a similar purpose, they are not the same and have distinct differences that set them apart.
Bollinger Bands:
Developed by John Bollinger in the 1980s, Bollinger Bands consist of a middle band, which is a simple moving average, and an upper and lower band that represent the standard deviation of price movements. The upper and lower bands dynamically adjust themselves based on market volatility, expanding during periods of high volatility and contracting during periods of low volatility. Traders often use Bollinger Bands to identify overbought and oversold conditions, as well as potential breakouts and trend reversals.
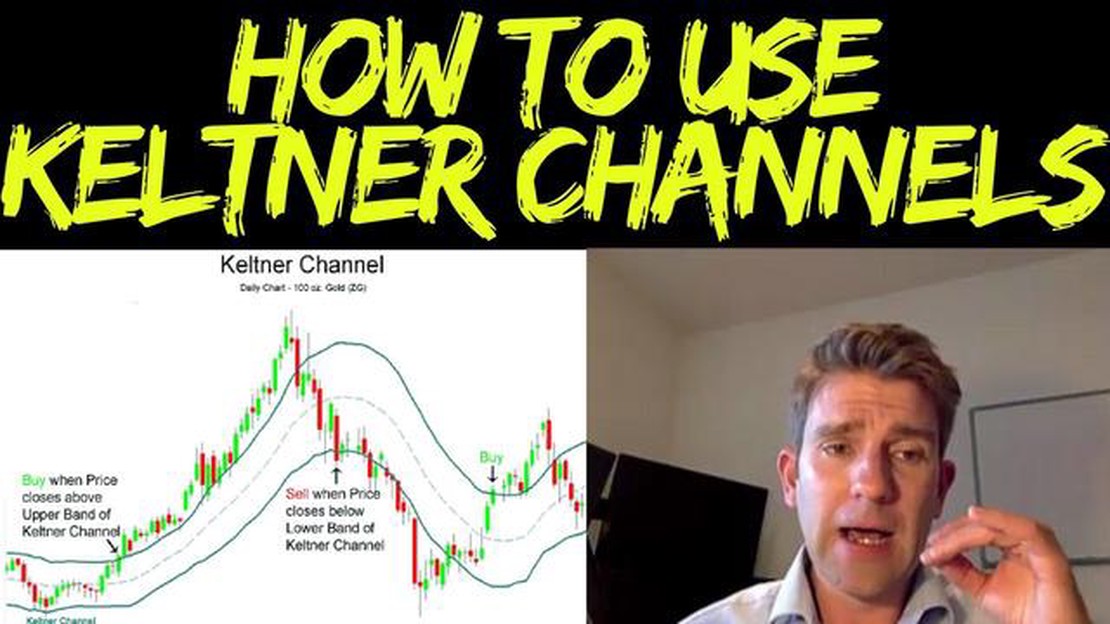
Keltner Channels:
Contrary to Bollinger Bands, Keltner Channels were developed by Chester Keltner and are based on the Average True Range (ATR) indicator. Keltner Channels consist of an exponential moving average line in the middle and two outer lines that are determined by multiplying the ATR by a certain multiplier value. The main purpose of Keltner Channels is to identify the average price range or volatility of an asset, and traders often use them to find potential entry and exit points for their trades.
Differences and Similarities:
Although both Bollinger Bands and Keltner Channels aim to identify potential trading opportunities, the key difference lies in the way they calculate volatility. While Bollinger Bands use the standard deviation of price movements, Keltner Channels rely on the Average True Range (ATR) indicator. Additionally, the outer bands of Bollinger Bands are based on a fixed number of standard deviations, whereas the outer lines of Keltner Channels are determined by multiplying the ATR by a multiplier value.
However, despite these differences, both indicators can be useful in determining overbought and oversold conditions, as well as spotting potential breakout and reversal points. Traders often use both indicators in combination with other technical analysis tools to confirm their trading decisions and increase the probability of success.
In conclusion, while Bollinger Bands and Keltner Channels have their distinct differences in terms of calculation and methodology, they share a common goal of assisting traders in identifying potential trading opportunities. Understanding the nuances of each indicator can help traders make more informed decisions and enhance their trading strategies.
Bollinger Bands and Keltner Channels are both popular technical analysis tools used by traders and investors to identify potential price reversals and profit opportunities in financial markets. While they are similar in some ways, there are also key differences between the two indicators.
Bollinger Bands:
Bollinger Bands consist of three lines: the upper band, the middle band (which is a moving average), and the lower band. The upper and lower bands are typically set two standard deviations away from the middle band, creating a channel that encapsulates the price action.
The middle band represents the trend direction, while the upper and lower bands provide a measure of price volatility. When the price moves towards the upper band, it is considered overbought, and when it moves towards the lower band, it is considered oversold. Traders often look for price reversals when the price touches or crosses the bands.

Keltner Channels:
Keltner Channels, on the other hand, consist of three lines: the center line, the upper channel line, and the lower channel line. The center line is calculated using an exponential moving average, while the upper and lower channel lines are calculated by adding and subtracting a multiple of the average true range from the center line.
Read Also: Is Weighted Moving Average a Time Series Model?
Similar to Bollinger Bands, Keltner Channels provide a measure of price volatility. When the price moves towards the upper channel line, it is considered overbought, and when it moves towards the lower channel line, it is considered oversold. Traders use Keltner Channels to identify potential price reversals when the price touches or crosses the channel lines.
Differences:
One key difference between Bollinger Bands and Keltner Channels is the way they calculate volatility. Bollinger Bands use standard deviation, while Keltner Channels use the average true range. This can lead to differences in the width and positioning of the channels, potentially impacting trading decisions.
Another difference is the interpretive approach. Bollinger Bands are often used to identify periods of low volatility followed by periods of high volatility, known as “Bollinger Band Squeeze,” which can signal that a big move is about to occur. Keltner Channels, on the other hand, are used to identify overbought and oversold conditions and potential price reversals.
Similarities:
Despite their differences, Bollinger Bands and Keltner Channels share some similarities. Both indicators provide a visual representation of price volatility and can help traders identify potential entry and exit points. They can also be used in conjunction with other technical analysis tools to confirm signals and enhance trading strategies.
In conclusion, Bollinger Bands and Keltner Channels are both valuable tools for traders and investors. Understanding their key differences and similarities can help traders make informed decisions and improve their trading strategies.
Bollinger Bands and Keltner Channels are both popular technical indicators used in technical analysis to identify potential entry and exit points in a market. While they both aim to measure volatility and identify overbought and oversold conditions, there are several key differences between the two indicators.
Read Also: Who Fills A2 Form? | Complete Guide for Filing A2 Form
1. Calculation:
Bollinger Bands are calculated using a moving average and standard deviations, while Keltner Channels are calculated using an exponential moving average and True Range. This difference in calculation methods leads to variations in the shape and positioning of the bands/channels.

2. Band/Channel Width:
Bollinger Bands use standard deviations to determine the width of the bands, while Keltner Channels use the Average True Range (ATR) to determine the width of the channels. As a result, Bollinger Bands tend to widen during periods of high volatility and contract during periods of low volatility, while Keltner Channels may not show such distinct changes in width.
3. Band/Channel Placement:
While both indicators are typically placed around a central moving average line, the placement of the bands/channels differs. Bollinger Bands are typically placed a certain number of standard deviations away from the moving average, creating a dynamic envelope around the price. Keltner Channels, on the other hand, are typically placed a certain multiple of the Average True Range away from the exponential moving average, resulting in channels that expand and contract with price movements.
4. Interpretation:
Bollinger Bands are often used to identify potential price reversals or breakouts when the price reaches the outer bands. Conversely, Keltner Channels are commonly used to identify trends and measure volatility. Traders may use different strategies and techniques when interpreting signals generated by these indicators.
5. Application:
While Bollinger Bands and Keltner Channels can be applied to various financial instruments and timeframes, they may be more suitable for different trading styles and market conditions. Bollinger Bands are often used in range-bound markets to identify potential support and resistance levels. Keltner Channels, on the other hand, may be used in trending markets to identify potential breakouts or continuation patterns.
In conclusion, while Bollinger Bands and Keltner Channels have similarities in their purpose of measuring volatility and identifying overbought and oversold conditions, their differences in calculation, width, placement, interpretation, and application make them distinct indicators with unique strengths and weaknesses. Traders may choose to use either or both indicators based on their trading strategies and preferences.
Bollinger Bands and Keltner Channels are technical analysis tools used in stock market analysis to identify price trends and potential trading opportunities. Bollinger Bands are based on standard deviations of price and are typically used to identify overbought or oversold conditions. Keltner Channels, on the other hand, are based on average true range and are used to identify potential breakouts or reversals.
The main difference between Bollinger Bands and Keltner Channels lies in the calculation methods and the interpretation of their results. Bollinger Bands use standard deviations to determine the upper and lower bands, while Keltner Channels use average true range to determine the channel boundaries. Additionally, Bollinger Bands are often used to identify overbought or oversold conditions, while Keltner Channels are used to identify breakouts or reversals.
There is no definitive answer to which tool is more accurate, as it largely depends on the individual trader’s trading style and preferences. Both Bollinger Bands and Keltner Channels have their own strengths and limitations. It is advisable for traders to experiment with both tools and determine which one suits their trading strategy and objectives best.
Bollinger Bands and Keltner Channels can be used together to obtain more comprehensive market analysis. Traders can use Bollinger Bands to identify overbought or oversold conditions, while Keltner Channels can be used to identify potential breakouts or reversals. By using both tools in conjunction, traders can gain a better understanding of the market dynamics and potentially enhance their trading decisions.

Understanding the Insights of Moving Average Analysis When it comes to analyzing financial data, one of the most commonly used tools is the moving …
Read Article
Minimum Withdrawal on Axiory: Everything You Need to Know When it comes to withdrawing funds from your Axiory account, it is important to be aware of …
Read Article
Understanding the Difference Between ESPP and Stock Options Employee stock ownership plans (ESPPs) and stock options are two common types of equity …
Read Article
Modifying a Remington 870: What You Need to Know If you’re a firearm enthusiast, you’ve probably heard of the Remington 870. It’s a popular …
Read Article
Who bought out Husky? Acquisitions and mergers are common in the business world, and the recent acquisition of Husky has left many people wondering …
Read Article
Is IQ Option allowed in Nigeria? IQ Option is a popular online trading platform that allows users to trade a wide variety of financial instruments …
Read Article


