For any trader, understanding and effectively using moving day averages is a crucial skill. Moving averages provide important insights into the trend and momentum of a particular security or market. They smooth out the noise and fluctuations in price data, allowing traders to identify key support and resistance levels, as well as potential entry and exit points.
There are different types of moving averages that traders can use, such as simple moving averages (SMA) and exponential moving averages (EMA). SMA gives equal weight to all data points over a specified period, while EMA gives more weight to recent data points. Traders can choose the type of moving average that best suits their trading style and objectives.
Table Of Contents
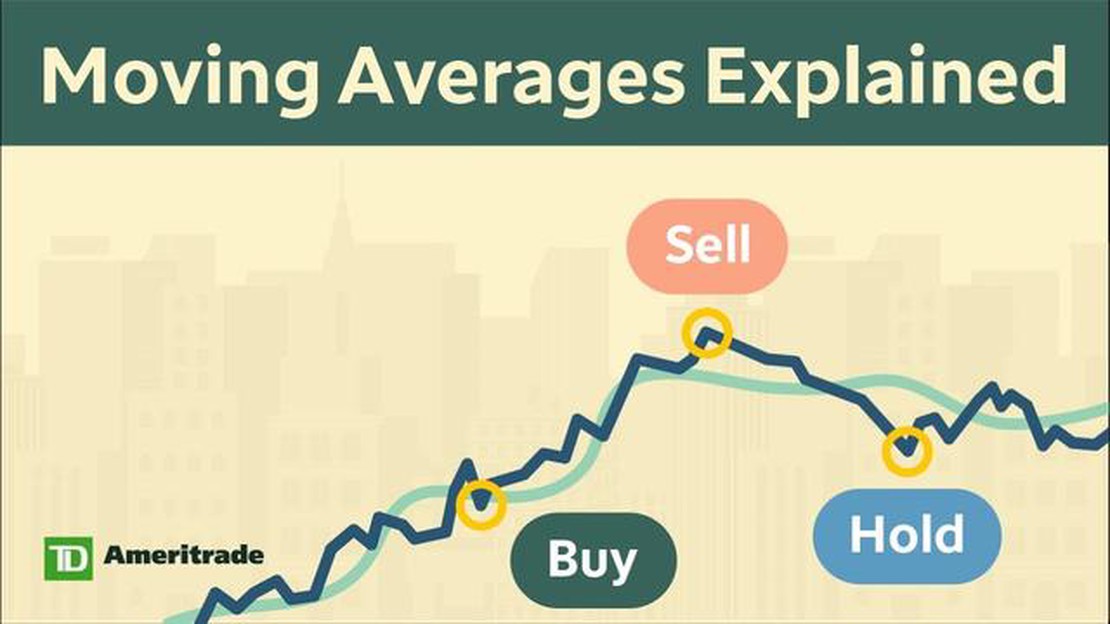
One of the most common ways to use moving averages is to identify trend reversals. When the price of a security crosses above its moving average, it can be a bullish signal, indicating a potential uptrend. Conversely, when the price crosses below the moving average, it can be a bearish signal, suggesting a potential downtrend.
It is important to note that moving averages are lagging indicators, meaning they are based on past price data. Therefore, it is crucial to use them in conjunction with other technical analysis tools and indicators to confirm trading signals and make informed decisions.
Another popular use of moving averages is to determine support and resistance levels. The moving average acts as a dynamic level that can provide traders with valuable insights into the strength of a trend. For example, if the price consistently bounces off a moving average from below, it can be considered a strong support level. On the other hand, if the price consistently fails to break above a moving average, it can be seen as a strong resistance level.
By effectively using moving day averages, traders can enhance their technical analysis and make more informed trading decisions. Whether it is to identify trend reversals, determine support and resistance levels, or as part of a broader trading strategy, moving averages are a powerful tool in a trader’s arsenal. However, it is important to remember that no single indicator can guarantee successful trades. Traders should always use moving averages in conjunction with other technical analysis tools and risk management techniques.
What are moving day averages?
In trading, moving day averages are a commonly used technical indicator that helps traders identify trends and make informed decisions. A moving day average is calculated by taking the average of a certain number of closing prices over a specific period of time, commonly referred to as the “moving” period.
The moving day average can be calculated based on different time frames, such as 10, 20, 50, or 200 days. Traders choose the appropriate time frame based on their trading strategy and preferences.
By using moving day averages, traders can smooth out short-term price fluctuations and focus on the overall trend. When the price of an asset is consistently above its moving day average, it is often seen as a bullish signal, indicating that the asset’s price is likely to continue rising in the near future. On the other hand, when the price is consistently below the moving day average, it is seen as a bearish signal, signaling that the price is expected to decline.
Traders can also analyze the relationship between different moving day averages to explore further trading opportunities. For example, when a shorter-term moving day average crosses above a longer-term moving day average, it is known as a “golden cross” and is seen as a bullish signal. Conversely, when a shorter-term moving day average crosses below a longer-term moving day average, it is known as a “death cross” and is seen as a bearish signal.
Overall, moving day averages are a valuable tool for traders to observe price trends, identify potential entry or exit points, and make informed trading decisions. However, it is important to note that no single indicator can guarantee successful trading, and traders should incorporate other analysis techniques and risk management strategies into their trading approach.
Why are moving day averages important in trading?
Moving day averages are an essential tool for traders in the financial markets. They provide valuable insights into the price trends of a particular asset or security over a specific period of time. By calculating the average price of an asset over a set number of days, moving day averages help traders identify potential entry and exit points for their trades.
One of the primary benefits of using moving day averages is their ability to smooth out short-term price fluctuations. This helps traders identify the underlying trend of an asset, which can be difficult to see when looking at raw price data. By focusing on the average price over a specific number of days, traders can minimize the impact of temporary market noise and make more informed trading decisions.
Another advantage of moving day averages is their ability to act as support and resistance levels in the market. Traders often use moving day averages to determine areas where the price of an asset is likely to find support or face resistance. When the price of an asset approaches a moving day average from below, it may find support and potentially rebound. Conversely, when the price approaches a moving day average from above, it may face resistance and potentially reverse its trend.
Furthermore, moving day averages can be used to generate trading signals. By comparing different moving day averages, traders can identify crossovers or divergences that may indicate a change in trend. For example, a bullish signal may be generated when a short-term moving day average crosses above a long-term moving day average, indicating a potential upward trend. Conversely, a bearish signal may be generated when a short-term moving day average crosses below a long-term moving day average, indicating a potential downward trend.
In conclusion, moving day averages are important in trading because they help traders identify trends, determine support and resistance levels, and generate trading signals. By incorporating moving day averages into their analysis, traders can make more informed decisions and increase their chances of success in the financial markets.
FAQ:
What are moving averages in trading?
Moving averages are a commonly used technical analysis tool in trading. They are calculated by taking the average price of a security over a specific number of periods. This average is then plotted on a chart to help traders identify trends and potential entry or exit points.
How can moving averages help traders in their decision making?
Moving averages can help traders by smoothing out price data, making it easier to identify trends. They can also act as support or resistance levels, indicating potential buy or sell signals. By using moving averages, traders can get a clearer picture of the market and make more informed decisions.
What are the different types of moving averages?
There are several types of moving averages, including simple moving averages (SMA), exponential moving averages (EMA), weighted moving averages (WMA), and smoothed moving averages (SMMA). Each type is calculated in a slightly different way, but they all aim to provide a smoothed average of price data.
How do traders use moving averages to determine trends?
Traders can use moving averages to determine trends by comparing multiple averages with different time periods. For example, if a shorter-term moving average (e.g. 50-day) crosses above a longer-term moving average (e.g. 200-day), it may indicate an uptrend. Conversely, if the shorter-term average crosses below the longer-term average, it may indicate a downtrend.
Can moving averages be used in conjunction with other technical indicators?
Yes, moving averages can be used in conjunction with other technical indicators to further enhance trading signals. For example, traders may use a moving average crossover combined with a momentum oscillator, such as the Relative Strength Index (RSI), to confirm potential entry or exit points.
What are moving averages?
Moving averages are technical indicators used in trading to analyze the price trends and determine potential support and resistance levels. They are calculated by taking the average price of a security over a specific period of time.
Does eToro use MT4? eToro is a well-known social trading platform that allows users to trade a variety of assets, including stocks, cryptocurrencies, …