

Which indicator is the most effective for ADX? Discover the top options.
What is the best indicator for ADX? When it comes to trading in the financial market, having a reliable indicator is crucial. The Average Directional …
Read Article
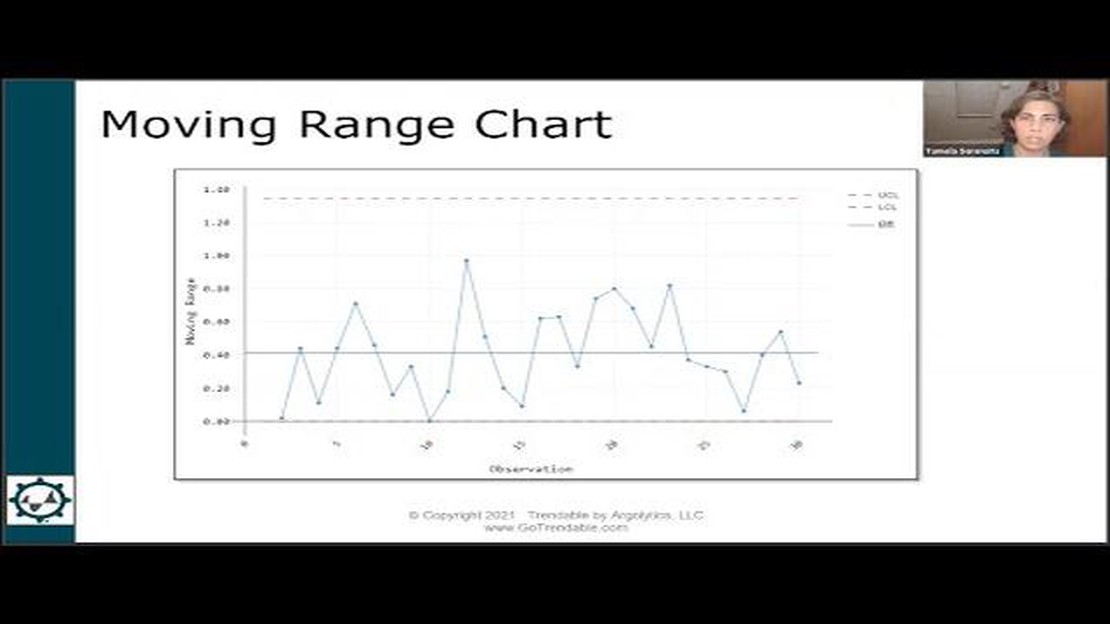
Quality control is a crucial aspect of any manufacturing process. It ensures that products meet certain standards and consistently deliver the expected level of performance. One of the tools used in quality control is the moving range chart. This chart helps monitor the variation in a process over time, allowing manufacturers to identify and address any issues that may be affecting quality.
The moving range chart is a statistical tool that plots the range between successive data points in a process, instead of the individual data points themselves. This chart is particularly useful in situations where the data is collected using a continuous or time-based method. By tracking the movement of the range, manufacturers can gain insights into how the process is changing and whether it is within acceptable limits.
The moving range chart is an essential companion to other control charts, such as the X-bar chart. While the X-bar chart provides information about the central tendency of a process, the moving range chart complements it by providing information about process variation. This combination of charts allows manufacturers to both monitor the average performance of a process and detect any changes in its variability.
By using the moving range chart, manufacturers can proactively identify and address any issues that may be affecting the quality of their products. It helps them understand the patterns and trends in process variation, enabling them to take corrective actions before it impacts product quality or customer satisfaction. Ultimately, the use of the moving range chart in quality control contributes to the delivery of high-quality products and the continuous improvement of manufacturing processes.

In quality control, it is essential to have tools that can monitor and analyze data to ensure that a process is performing consistently and producing high-quality products or services. One such tool is the moving range chart.
The moving range chart is a graphical representation of the variation in a process over time. It is based on the concept of the moving range, which is the difference between consecutive data points. By analyzing the moving range, quality control professionals can identify patterns and trends in the variation of a process.
The moving range chart is particularly useful when the data being analyzed does not follow a normal distribution or when there are non-random patterns in the process variation. It can help identify potential issues, such as shifts or trends in the process mean, sudden changes in variability, or the presence of outliers.
Read Also: Understanding the ANZ Conversion Fee: Everything You Need to Know
To create a moving range chart, the data is first plotted on a control chart. The moving range between each pair of consecutive data points is then calculated, and these values are plotted on a separate chart. The control limits for the moving range chart are derived from statistical calculations and indicate the expected range of variation in the moving range.
By monitoring the moving range chart, quality control professionals can quickly and easily identify when the process is out of control or when there are changes in the variation that need to be addressed. This allows for timely intervention and corrective actions to be taken, helping to maintain consistent quality and prevent defects or deviations from specifications.
| Advantages of the Moving Range Chart | Disadvantages of the Moving Range Chart |
|---|---|
| 1. It provides a visual representation of the process variation. | 1. It may be less suitable for processes with large data sets or high-frequency data. |
| 2. It can help identify non-random patterns or trends in the process. | 2. It relies on accurate and consistent data collection. |
| 3. It allows for timely intervention and corrective actions. | 3. It may not be suitable for processes with frequent changes or short production runs. |
The moving range chart is a valuable tool in quality control as it helps identify variation and maintain consistent quality. By monitoring the moving range, quality control professionals can take proactive measures to ensure that the process remains in control and yields high-quality products or services.
Implementing a moving range chart into your quality control process can offer several key benefits. These benefits include:
Overall, the moving range chart is an invaluable tool for quality control, providing real-time monitoring, early detection of process variations, and insights for process improvement. By incorporating this chart into your quality control process, you can enhance the overall performance and reliability of your operations.
Implementing the moving range chart in quality control is essential for monitoring and improving the quality of manufacturing processes. To ensure accurate and reliable results, it is important to follow certain best practices:
By following these best practices, organizations can effectively implement the moving range chart in quality control and drive improvements in process performance and product quality.
Read Also: Is MetaTrader 5 free to use? Find out the cost of MetaTrader 5 software
A moving range chart is a statistical tool used in quality control to monitor the variability of a process over time. It plots the range between consecutive data points on a process chart.
The moving range chart is important for quality control because it helps detect any out-of-control points or trends in the process variability. By tracking the range between consecutive data points, it allows managers to quickly identify shifts or patterns that could indicate problems in the quality of the output.
The moving range is calculated by taking the absolute difference between consecutive data points in a process. The moving range chart then plots these range values over time to visualize the variability in the process.

One of the main advantages of using a moving range chart is that it can provide early warning signals of process variability before it becomes a major issue. It also allows for a more accurate assessment of process capability and helps in setting appropriate control limits.
A moving range chart should be used when there is a need to monitor the variability of a process over time, especially in situations where small shifts in the process can result in significant changes in output quality. It is particularly useful for continuous improvement efforts and for maintaining consistent quality standards.
A moving range chart is a graphical tool used in quality control to monitor the variability of a process. It displays the range between consecutive measurements and helps to identify any patterns or shifts in the process.

What is the best indicator for ADX? When it comes to trading in the financial market, having a reliable indicator is crucial. The Average Directional …
Read Article
The Best Strategy for Dealing with Volatility Volatility is a natural and inevitable aspect of the financial markets. It refers to the degree of …
Read Article
Does Questrade Offer Forex Trading Services? Welcome to the Questrade FAQ! In this article, we will answer the question of whether Questrade offers …
Read Article
How many pips do scalpers make per day? Scalping is a popular trading strategy employed by forex traders to make quick profits in the market. This …
Read Article
Understanding the Costs of Moving: A Comprehensive Guide When you are planning a move, it is important to consider all the expenses that come with it. …
Read Article
When must the options disclosure document be provided? If you are considering investing in options, it is crucial to understand the requirements for …
Read Article


