

What is EWMA Used For? Learn About the Exponential Weighted Moving Average
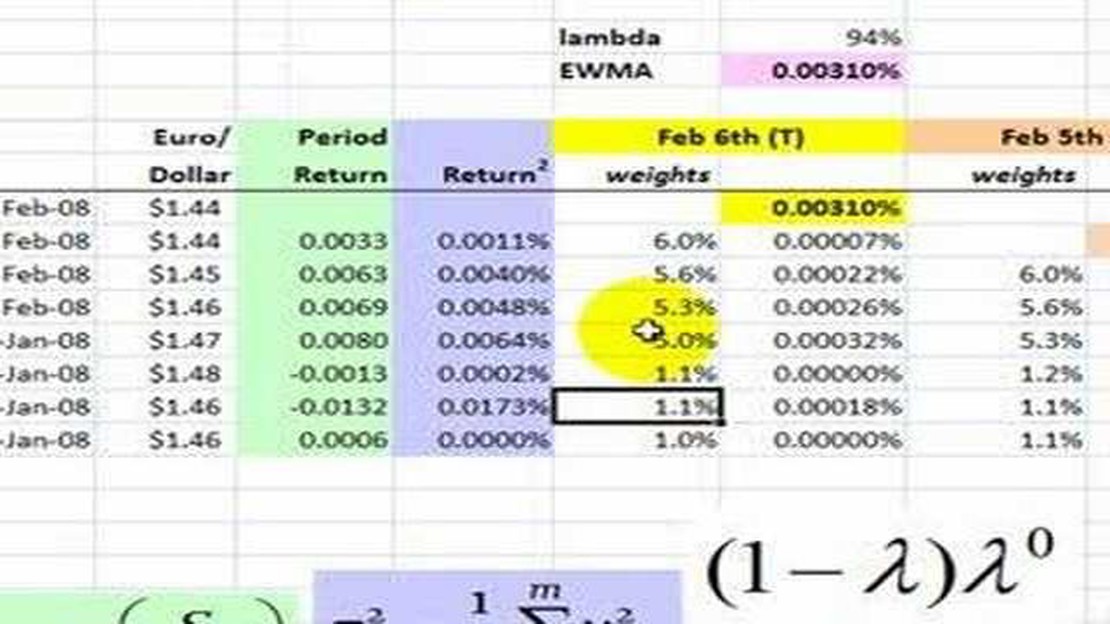
Importance and Applications of Exponentially Weighted Moving Average (EWMA) The Exponential Weighted Moving Average (EWMA) is a statistical method …
Read Article
The 20 day EMA (Exponential Moving Average) is a widely used technical indicator that is commonly used by traders to help identify trends and potential entry and exit points in the market. It is a moving average that gives more weight to recent price data, making it more responsive to current market conditions.
The 20 day EMA is often considered a key metric for short-term traders as it provides a good balance between responsiveness and smoothing out market noise. It helps to filter out short-term fluctuations and highlights the overall direction of the market. By focusing on the 20 day EMA, traders can quickly identify trends and make more informed trading decisions.
One effective way to use the 20 day EMA is to combine it with other technical indicators such as support and resistance levels, trendlines, and momentum oscillators. This can help confirm potential trading signals and increase the probability of successful trades. For example, if the price of a stock or a currency pair is above the 20 day EMA and there is a bullish crossover with a shorter-term moving average, it may be a signal to enter a long position.
However, it’s important to note that no single indicator should be used in isolation, and traders should always consider the context of the overall market conditions, as well as other factors such as fundamental analysis, before making any trading decisions.
In conclusion, the 20 day EMA is a valuable tool for traders looking to capitalize on short-term trends in the market. When used in conjunction with other indicators and taking into account the broader market context, it can provide valuable insights and help increase the accuracy of trading decisions.
The 20 day Exponential Moving Average (EMA) is a popular technical indicator used by traders to analyze the stock market. It is a type of moving average that gives more weight to recent price data, making it more responsive to short-term price changes compared to other moving averages.

The EMA is calculated by taking the average of the closing prices over a specific period, in this case, 20 days. The recent price data is given more weight, with the most recent price having the highest weight. This helps to capture the current trend and identify potential buying or selling opportunities.
The 20 day EMA is used to identify the overall trend in the market. When the price is above the 20 day EMA, it is generally considered an uptrend, indicating that the market is bullish. On the other hand, when the price is below the 20 day EMA, it is considered a downtrend, indicating that the market is bearish.
In addition to identifying the trend, the 20 day EMA can also be used to generate trading signals. One common strategy is to look for a bullish crossover, which occurs when the price moves above the 20 day EMA. This is seen as a buying signal and indicates that the stock may continue to rise.
Conversely, a bearish crossover occurs when the price moves below the 20 day EMA. This is seen as a selling signal and indicates that the stock may continue to decline. Traders can use these signals to enter or exit positions and manage their risk accordingly.
Read Also: Best Proprietary Trading Firms in Nigeria: A Comprehensive Guide
It is important to note that the 20 day EMA should not be used in isolation. It should be used in conjunction with other technical indicators and analysis to confirm signals and make informed trading decisions. Additionally, it is important to consider other factors such as market conditions, news events, and the overall health of the stock or market.
By understanding and effectively using the 20 day EMA, traders can gain valuable insights into market trends and make more informed trading decisions. It is a versatile tool that can be used in various trading strategies and timeframes, making it an essential tool for traders of all levels of experience.
Using the 20 day EMA, or Exponential Moving Average, in your trading strategy can provide several benefits. The 20 day EMA is a popular technical indicator used by traders to identify trends and potential entry and exit points for trades.
One of the main advantages of using the 20 day EMA is its ability to smooth out price volatility and provide a clearer picture of the overall trend. By calculating the average price over the past 20 days and giving more weight to recent prices, the 20 day EMA provides a more responsive indicator compared to other moving averages.
Another benefit of using the 20 day EMA is its versatility in different market conditions. Whether the market is trending up, down, or moving sideways, the 20 day EMA can help traders identify potential reversals or continuation patterns. It can also be used as a support or resistance level, providing additional confirmation for trade entries and exits.
Furthermore, the 20 day EMA can be used in conjunction with other technical indicators to enhance trading decisions. For example, traders may look for a crossover between the 20 day EMA and a shorter-term moving average, such as the 9 day EMA, to generate buy or sell signals. This combination can increase the accuracy of trade entries and exits.
Read Also: Understanding the Key Differences between CFD and DFD
Using the 20 day EMA also helps traders stay disciplined and avoid emotional decision-making. By relying on a systematic approach based on technical analysis, traders can remove the influence of emotions and stick to their trading plan. This can lead to more consistent and profitable trading results.
In conclusion, the 20 day EMA is a valuable tool for traders looking to improve their trading strategy. Its ability to smooth out price volatility, adapt to different market conditions, work alongside other indicators, and promote disciplined trading makes it an essential component for successful trading. Incorporating the 20 day EMA into your trading strategy can potentially enhance your trading decisions and increase your chances of achieving consistent profits.
The 20 day EMA is a technical indicator used in trading which calculates the average price of a security over a 20-day period.
The 20 day EMA can help traders identify the direction of the trend and potential entry and exit points. It provides a smoother representation of price movements compared to other moving averages.

The 20 day period is commonly used in the EMA because it provides a good balance between responsiveness to short-term price changes and smoothness of the average. It is a widely accepted period for trend analysis.
One way to use the 20 day EMA is to look for buy signals when the price crosses above the EMA line, indicating a potential uptrend. Conversely, sell signals can be identified when the price crosses below the EMA line, indicating a potential downtrend.
While the 20 day EMA can be a useful tool, it should be used in conjunction with other technical indicators and analysis methods. It is not a foolproof strategy and can generate false signals, especially in volatile markets.
The 20 day EMA, or Exponential Moving Average, is a technical indicator used in trading to analyze the price movement of a security over a 20-day period.

Importance and Applications of Exponentially Weighted Moving Average (EWMA) The Exponential Weighted Moving Average (EWMA) is a statistical method …
Read Article
How long can you hold a stock option? Stock options offer investors the opportunity to buy or sell shares of a stock at a predetermined price within a …
Read Article
Understanding Authorized but not Issued Shares When it comes to understanding the intricacies of a company’s stock structure, the term “authorized but …
Read Article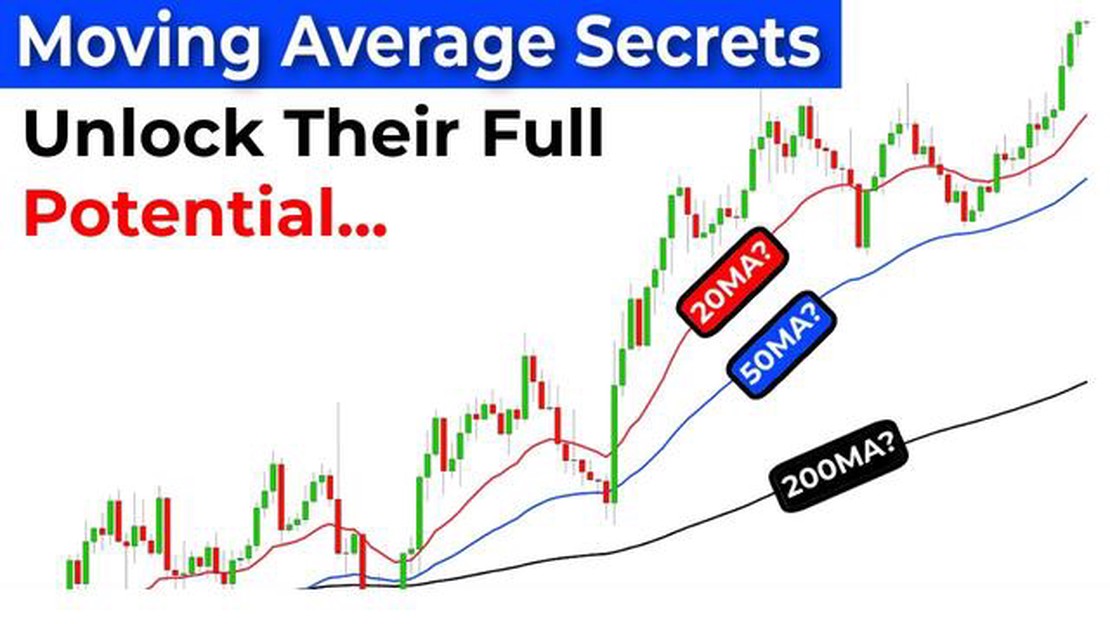
Understanding the T Line Moving Average: A Comprehensive Guide The T line moving average is a technical analysis tool used by traders to identify the …
Read Article
Comparison of HotForex and Exness: Which Broker is the Best? When it comes to choosing a reputable and reliable forex broker, two names often come to …
Read Article
Understanding Schedule D UK: A Comprehensive Guide When it comes to running a business in the United Kingdom, understanding the tax reporting …
Read Article


