


Will CAD to Euro Exchange Rate Increase? | Forex Forecast
CAD to Euro: Will the Currency Exchange Rate Go Up? The Canadian dollar (CAD) to Euro (EUR) exchange rate is a topic of interest for investors and …
Read Article
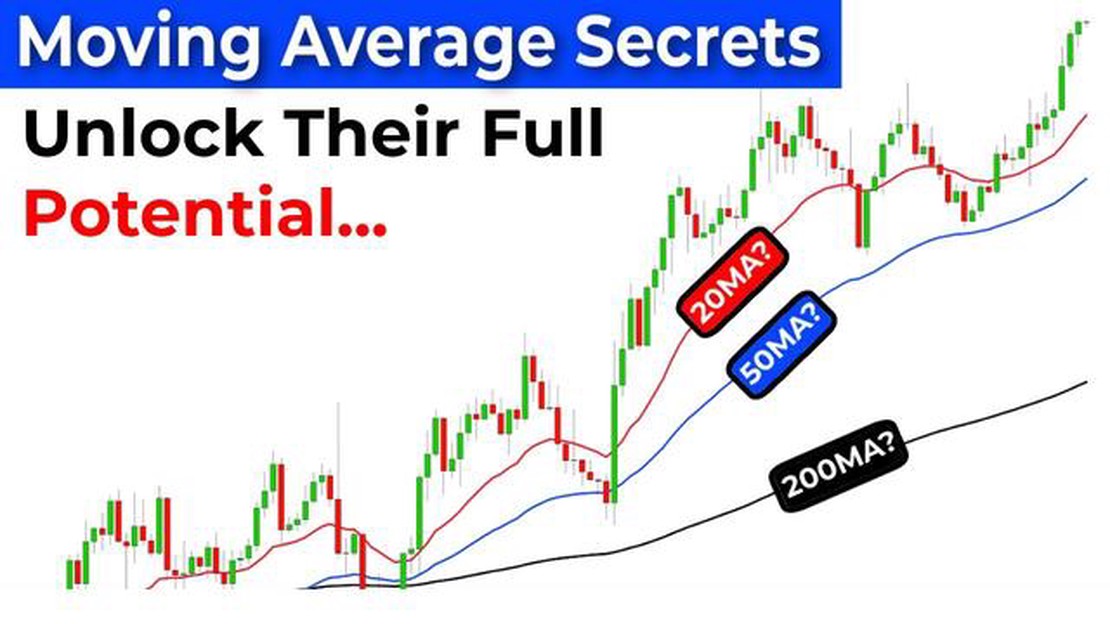
Calculating moving averages is an essential skill in data analysis and forecasting. A moving average is a widely used statistical calculation that helps to identify trends and patterns in time series data. It is particularly useful for smoothing out fluctuations and noise in data, allowing you to gain a clearer understanding of underlying patterns.
To calculate a moving average time, you simply take the average of a set of data points within a certain window or time interval. The size of the window will depend on the specific application and the level of detail you require. A smaller window will provide a more detailed view but may be more prone to noise, while a larger window will provide a smoother trend but may reduce the level of detail.
There are several methods to calculate moving averages, including the simple moving average (SMA), weighted moving average (WMA), and exponential moving average (EMA). The choice of method will depend on the specific data set and the desired level of accuracy. In this article, we will focus on the simple moving average method, which is widely used and relatively easy to understand.
The simple moving average is calculated by summing up a specific number of data points within a time window and dividing the sum by the number of data points. For example, to calculate a 5-day moving average on a stock price data set, you would sum up the closing prices for the past 5 days and divide the sum by 5.
By calculating moving averages, you can better understand the overall trend of your data and make more informed decisions. Whether you are analyzing stock prices, sales data, or any other time series data, the moving average is a valuable tool to have in your data analysis toolkit.
A moving average is a commonly used statistical calculation that helps identify trends and patterns in data over a certain period of time. It is often used in finance, economics, and other fields to analyze and forecast data.
The moving average is calculated by adding up a set of data points over a specific time period and then dividing the sum by the number of data points. This process is repeated for each successive time period to create a series of moving averages.
| Time Period | Data Point 1 | Data Point 2 | Data Point 3 | … | Data Point N | Moving Average |
|---|---|---|---|---|---|---|
| 1 | 10 | 15 | 12 | … | 8 | 11.5 |
| 2 | 15 | 12 | 8 | … | 10 | 11.4 |
| 3 | 12 | 8 | 10 | … | 15 | 11.6 |
| … | … | … | … | … | … | … |
| N | 8 | 10 | 15 | … | 12 | 11.3 |
The moving average provides a smoothed and filtered representation of the data, which helps to identify underlying trends and patterns by reducing the impact of random fluctuations. It can be used to analyze the overall direction of the data, determine potential turning points, and make forecasts based on historical patterns.
There are different types of moving averages, such as the simple moving average (SMA), exponential moving average (EMA), weighted moving average (WMA), and cumulative moving average (CMA), each with its own calculation method and characteristics. The choice of moving average depends on the specific application and desired level of responsiveness to recent data.

In conclusion, a moving average is a valuable tool that provides insight into the underlying trends and patterns in data over time. By calculating and analyzing moving averages, researchers, analysts, and traders can make more informed decisions and predictions based on historical data.
The moving average is a widely used concept in time calculation. It is a useful tool in understanding trends and forecasting future values. By calculating the moving average, one can smooth out any fluctuations or irregularities in the data, making it easier to identify the underlying patterns.
One of the main benefits of using the moving average is that it helps in determining the overall trend of a dataset. It provides a clearer picture of whether the values are increasing, decreasing, or remaining constant over time. This can be particularly useful in various fields such as finance, economics, and analytics, where understanding long-term patterns is crucial.
The moving average also helps in eliminating noise or random variations in the data. It filters out short-term fluctuations that may not be relevant to the overall analysis or prediction. By smoothing out these irregularities, one can focus on the larger, more meaningful trends and make more accurate calculations or forecasts.
Read Also: Understanding the Mechanics of Open Interest in Futures Trading
Moreover, the moving average can be used to identify turning points or reversals in a dataset. By comparing the current value of the data with its moving average, one can determine whether the trend is changing direction. This can be valuable in making timely decisions or taking appropriate actions based on market or study insights.
Overall, the moving average is an essential tool in time calculation. Its ability to capture long-term trends, filter out noise, and identify reversals makes it a valuable asset in data analysis, prediction, and decision-making processes.
Read Also: Importance of Break-Even Analysis in Options Trading
Calculating moving average time is a useful tool in analyzing data trends over a certain period. It helps to smooth out fluctuations and highlight the overall direction of a data set. Here are the simple steps to calculate moving average time:
Step 1: Determine the number of data points you want to include in your moving average. This could be a specific number of days, months, or any other time interval that suits your analysis.
Step 2: Create a table with two columns: one for the time period and the other for the data values. Use a consistent time interval for each data point in the time period column.
Step 3: Populate the data values column with the corresponding values for each time period.

Step 4: Calculate the average of the first set of data points based on the number you determined in step 1. For example, if you want to calculate a 7-day moving average, take the sum of the first 7 data points and divide it by 7.
Step 5: Move the time period and data values columns by one row down and repeat step 4 for the next set of data points. Continue this process until you have calculated the moving average for all the data points.
Step 6: Plot the moving average data points on a graph to visualize the trend over time. This can help you identify any patterns or changes in the data set.
In conclusion, calculating moving average time involves determining the number of data points, creating a table with time periods and data values, calculating the moving average, and plotting the results. Following these simple steps can provide valuable insights into data trends.
Moving average time is a statistical calculation used to analyze trends and patterns in data over a specific period of time. It provides a way to smooth out fluctuations and highlight underlying trends in the data.
Moving average time is calculated by adding up a certain number of data points and dividing the sum by the total number of data points. This process is repeated for each subsequent time period to create a moving average time series.
Moving average time is useful because it helps to identify trends and patterns in data, making it easier to make predictions and forecasts. It also helps to smooth out noise and reduce the impact of outliers, providing a more accurate representation of the data.
Moving average time can be used in various industries and fields. For example, in finance, it can be used to analyze stock prices and identify trends. In marketing, it can be used to track customer behavior and predict future sales. In meteorology, it can be used to analyze weather patterns and make forecasts.

CAD to Euro: Will the Currency Exchange Rate Go Up? The Canadian dollar (CAD) to Euro (EUR) exchange rate is a topic of interest for investors and …
Read Article
The Intrinsic Value of an Option Options are a popular financial instrument that allow investors to speculate on the future price movement of an …
Read Article
How to Sell Options on the VIX: A Guide for Traders Are you interested in trading options on the VIX? If so, it’s important to understand the risks …
Read Article
Understanding FX Spot Risk Foreign exchange (FX) spot transactions are a common form of currency trading in the global financial markets. These …
Read Article
Maximum Leverage for easyMarkets When it comes to forex trading, leverage is a key feature that can greatly affect a trader’s ability to make profits. …
Read Article
Barclays Stock: All You Need to Know Barclays is a well-known British multinational investment bank and financial services company. It has a …
Read Article


