


How much cash is 100 yen? Convert yen to dollars and find out the exchange rate
What is the Value of 100 Yen in Cash? If you are planning a trip to Japan or simply want to know the current exchange rate for yen, this article is …
Read Article
Calculating a rolling average is a commonly used statistical method to analyze trends over a specific period of time. It is especially useful when dealing with financial or economic data, as it provides a smoothed representation of the data by eliminating random variations. In this step-by-step guide, we will walk you through the process of calculating a 3-month rolling average, which is particularly beneficial when you want to identify long-term trends while still capturing shorter-term fluctuations.
First, it’s important to understand what a rolling average is. Also known as a moving average, it is a series of averages calculated from different subsets of the total dataset. In the case of a 3-month rolling average, each data point is the average of the current month and the two preceding months. This rolling window moves forward, continuously updating the data points and smoothing out any short-term fluctuations that might obscure the overall trend.
To calculate a 3-month rolling average, follow these steps:
Note: It is worth mentioning that the size of the rolling window can vary depending on the specific analysis you are conducting. While a 3-month rolling average is commonly used, you can also calculate rolling averages for different time periods, such as 6 months or 12 months. The choice of the rolling window size depends on the frequency and length of the fluctuations you want to smooth out.
By calculating a 3-month rolling average, you can gain insights into the long-term trend of your data while still capturing the short-term changes in a more manageable format. This statistical technique is widely used in various fields, including finance, economics, and market research, to analyze and interpret time series data. Armed with this step-by-step guide, you can confidently calculate a 3-month rolling average and unlock valuable insights from your data.

A 3 month rolling average is a method of calculating an average over a certain time period to smooth out any fluctuations and identify overall trends. It is commonly used in financial and sales analysis to analyze data over a period of time and track the performance of a business.
To calculate a 3 month rolling average, you take the sum of the data points from the previous three months and divide it by three. This average is then used as the starting point for the next calculation, where the oldest data point is dropped and the newest data point is added. This process goes on for the entire time period, creating a rolling average that gradually shifts over time.
Read Also: The Psychology Behind Japanese Candlestick Charts: A Comprehensive Guide
The purpose of using a 3 month rolling average is to provide a more accurate representation of the data and smooth out any short-term fluctuations or outliers. By looking at the average over a longer time period, you can get a better understanding of the overall trend and make more informed decisions.
A 3 month rolling average can be used in various scenarios, such as analyzing monthly sales data, tracking revenue growth, or evaluating the performance of a stock. It helps to eliminate the impact of seasonal variations, identify long-term patterns, and predict future trends.
| Month | Data Point | 3 Month Rolling Average |
|---|---|---|
| January | 100 | - |
| February | 150 | - |
| March | 200 | 150 |
| April | 170 | 175 |
| May | 190 | 186.67 |
In the example above, we have a data set for the months January to May. To calculate the 3 month rolling average for March, we take the sum of the data points for January, February, and March (100 + 150 + 200 = 450) and divide it by three (450 / 3 = 150). The rolling average for April is calculated by dropping January and adding the data point for April (150 + 200 + 170 = 520 / 3 = 173.33). This process continues for the remaining months, resulting in a rolling average that provides a smoother representation of the data.
Calculating a 3 month rolling average can provide valuable insights into trends and patterns in data over time. It is a useful tool for analyzing and forecasting various business metrics, such as sales, revenue, or customer satisfaction.
Here are some reasons why calculating a 3 month rolling average is important:
Read Also: Understanding the 5 Day Moving Average: How it Works and Why it Matters
In summary, calculating a 3 month rolling average is a valuable technique for analyzing and interpreting data over time. It provides a smoothed measure that helps to reveal patterns, forecast future performance, and make informed business decisions.
A rolling average is a statistical calculation that calculates the average of a set of data points over a specific time period. It is used to smooth out fluctuations and identify trends in data over time.

Calculating a rolling average is important because it helps to eliminate short-term fluctuations or random noise in data and provides a clearer understanding of long-term trends. It is commonly used in finance, economics, and forecasting.
To calculate a 3 month rolling average, you need to first determine the range of data points you want to include in each average. Then, sum up the data points within each range and divide by the number of data points to get the average. Repeat this process for each subsequent range and update the average as new data points become available.
Using a rolling average has several advantages. It helps to smooth out short-term fluctuations in data, provides a clearer picture of long-term trends, and can help to identify anomalies or outliers. It is a useful tool for making predictions, forecasting, and making informed decisions based on historical data.

What is the Value of 100 Yen in Cash? If you are planning a trip to Japan or simply want to know the current exchange rate for yen, this article is …
Read Article
Top Competitors of Xe com Xe com is a well-known and widely used currency exchange website that provides users with up-to-date exchange rates and …
Read Article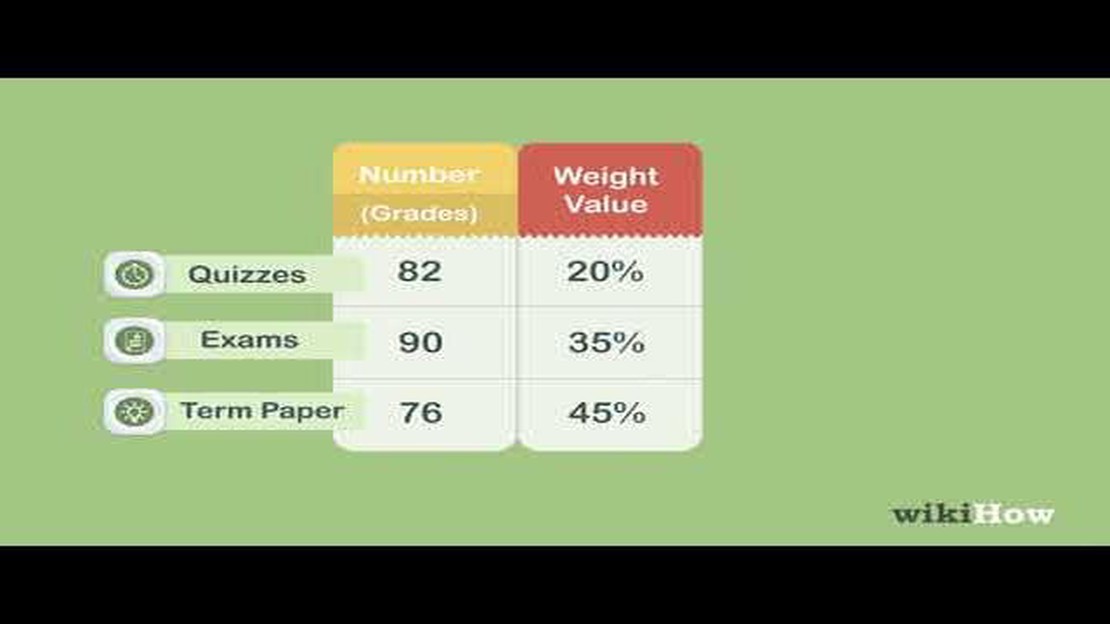
How to Calculate Weighted Average: Simple Example Calculating the weighted average is a useful tool in various fields, such as finance, statistics, …
Read Article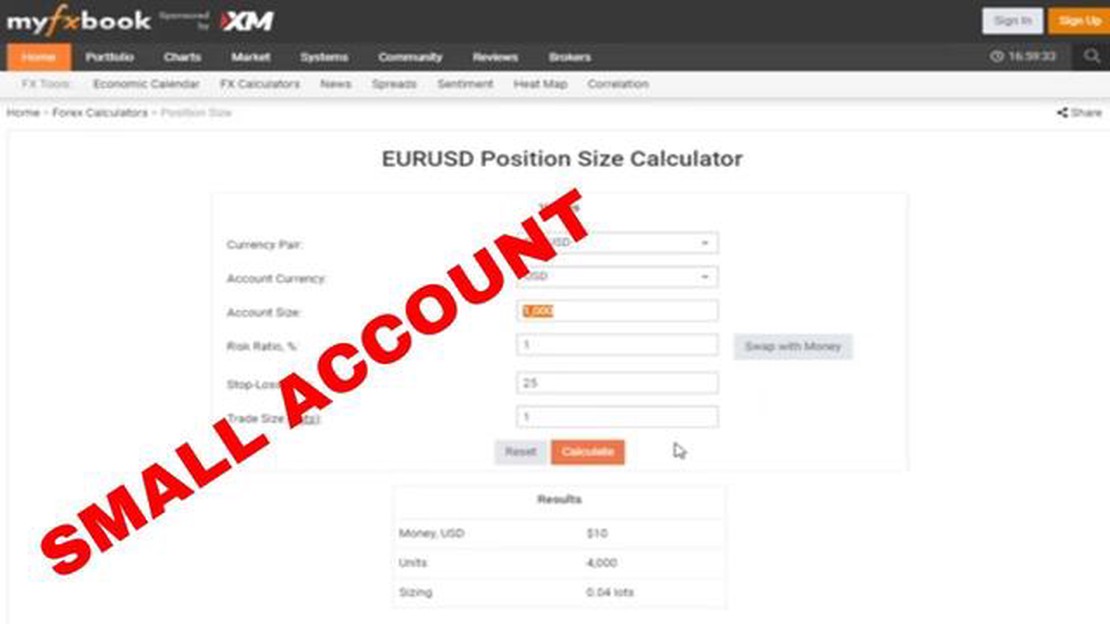
Understanding the Concept of a Cent Account If you are new to trading and want to dip your toes into the world of forex, cent accounts can be a great …
Read Article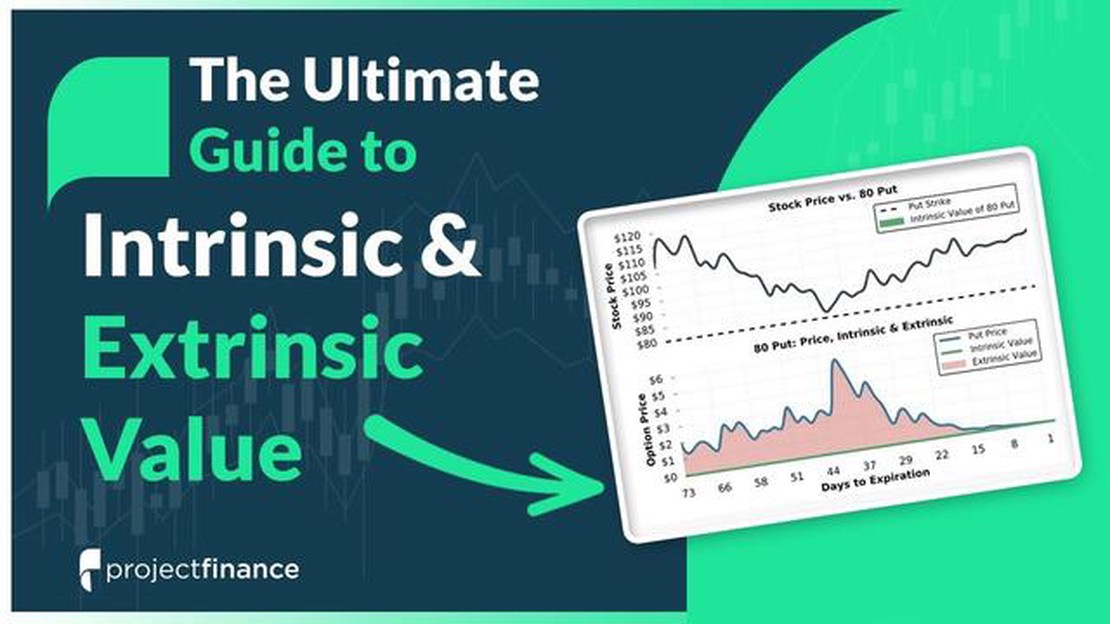
Understanding Intrinsic Value and Market Value Options When it comes to investing in options, it’s crucial to understand the difference between …
Read Article
Download Historical FX Rates: Where to Find the Best Data When it comes to analyzing foreign exchange rates, having access to accurate historical data …
Read Article


