

What happens to options on expiry? - Explained
What happens to options on expiry? Options are derivative contracts that give traders the right, but not the obligation, to buy or sell assets (like …
Read Article
The moving average indicator is one of the most widely used technical analysis tools in the financial markets. It helps traders and investors identify trends and potential reversals in stock prices, currencies, and other financial instruments. However, not many people understand the timeframe used in calculating the moving average.
The moving average is calculated by taking the average closing price of a stock or any other financial instrument over a certain period of time. This period is referred to as the timeframe. The most commonly used timeframes for the moving average are 10 days, 50 days, and 200 days. However, there are no strict rules about which timeframe to use and it often depends on the trader’s or investor’s strategy and time horizon.
Short-term traders may use a shorter timeframe, such as 10 or 20 days, to capture short-term price movements and generate more frequent trading signals. On the other hand, long-term investors may use a longer timeframe, such as 50 or 200 days, to identify long-term trends and make investment decisions.
It’s important to note that the choice of timeframe can greatly affect the moving average indicator’s performance. Shorter timeframes may provide more timely signals but may also generate more false signals due to market noise. Longer timeframes, on the other hand, may provide more reliable signals but may lag behind the market trends.
In conclusion, the timeframe used in the moving average indicator is flexible and depends on the trader’s or investor’s strategy and time horizon. It’s important to understand the strengths and limitations of different timeframes and choose one that best suits your trading or investment style.

The Moving Average Indicator is a technical analysis tool used in financial markets to smooth out price data and identify trends. It calculates the average price over a specific period of time, creating a line on a price chart that visually represents the average price movement.
The Moving Average Indicator is widely used by traders and investors to make informed decisions about buying and selling securities. It helps to eliminate short-term fluctuations and noise in the price data, providing a clearer picture of the overall trend.
There are different types of Moving Averages, such as the Simple Moving Average (SMA), Exponential Moving Average (EMA), and Weighted Moving Average (WMA). The most commonly used is the Simple Moving Average, which calculates the average price by summing up the closing prices over a selected number of periods and dividing it by the number of periods.
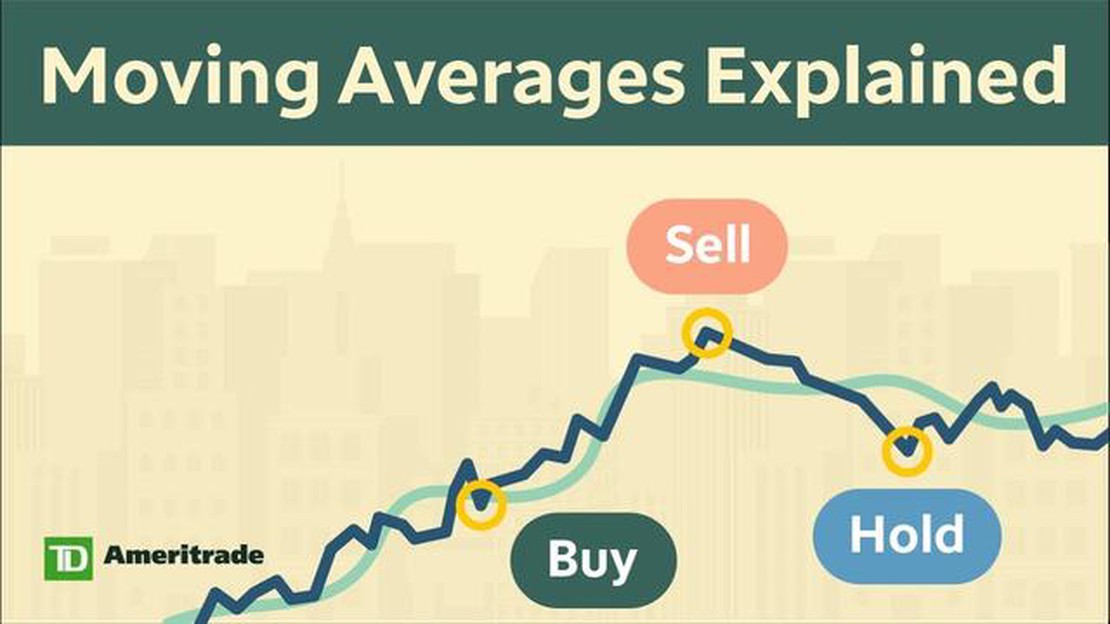
The Moving Average Indicator is often used to determine entry and exit points for trades. When the price is above the Moving Average line, it is considered bullish, indicating a potential uptrend. Conversely, when the price is below the Moving Average line, it is considered bearish, indicating a potential downtrend.
Traders also look for crossovers between different Moving Averages as signals for trend reversals. For example, when a shorter-term Moving Average crosses above a longer-term Moving Average, it generates a buy signal, while a crossover in the opposite direction generates a sell signal.
Overall, the Moving Average Indicator is a valuable tool for technical analysis, helping traders and investors to identify trends, filter out noise, and make informed trading decisions.
Read Also: Understanding the Moving Average of the Index: A Comprehensive Guide
The moving average indicator is a widely used technical analysis tool that helps traders identify trends and potential entry or exit points in the market. It is a lagging indicator, meaning that it takes into account historical price data to calculate the average, rather than predicting future prices.
The concept behind the moving average is relatively simple. It calculates the average price over a specified period of time, with each new data point replacing the oldest data point in the calculation. The result is a line that fluctuates in response to changes in the underlying price data.
Read Also: Is Forex Trading a Lucrative Side Hustle?
The calculation of the moving average involves summing up the closing prices over the specified period and dividing it by the number of data points. For example, a 10-day moving average would add up the closing prices of the last 10 days and divide it by 10. This process is repeated for each new data point, resulting in a moving line that reflects the average price over the specified time frame.
The choice of the time frame for the moving average depends on the trader’s strategy and the desired level of analysis. Shorter time frames, such as a 10-day moving average, provide a more responsive line that quickly reflects changes in price. On the other hand, longer time frames, such as a 200-day moving average, provide a smoother line that captures the long-term trend.
Traders often use different moving averages in conjunction with each other to gain a better understanding of the market. For example, a trader might use a shorter-term moving average to identify short-term trends and a longer-term moving average to identify the overall trend. By comparing the two moving averages, traders can make more informed trading decisions.
It is important to note that the moving average is not a standalone indicator and should be used in conjunction with other tools and analysis techniques. It is also important to consider other factors such as volume, volatility, and market conditions when interpreting the moving average line.
A moving average indicator is a widely used technical analysis tool that calculates an average price over a specific period of time and is used to identify trends and potential reversals in the financial markets.
The number of days that the moving average indicator is based on can vary depending on the trader’s preference and the time frame they are analyzing. Common periods include 50, 100, and 200 days.

The 50-day moving average is commonly used by traders to identify short-term trends in the market. It is often seen as a support or resistance level, meaning that if the price crosses above or below the 50-day moving average, it may signal a potential change in direction.
There is no definitive answer to this question as it depends on the trading strategy and the time frame being analyzed. Longer period moving averages, such as the 200-day moving average, are often used to identify long-term trends, while shorter period moving averages, such as the 20-day moving average, may provide more timely signals for short-term traders.
Yes, the moving average indicator can be applied to any financial market, including stocks, commodities, forex, and cryptocurrencies. It is a versatile tool that can help traders analyze price trends and make informed trading decisions.
The moving average indicator is a popular technical analysis tool that helps traders identify trends and potential entry or exit points in the market. It calculates the average price of a security over a specified period of time and plots it on a chart.

What happens to options on expiry? Options are derivative contracts that give traders the right, but not the obligation, to buy or sell assets (like …
Read Article
Understanding whether RSI is leading or lagging When it comes to technical analysis in the world of trading, one of the most popular indicators is the …
Read Article
What time does New Zealand start trading? The New Zealand market, also known as the New Zealand Exchange (NZX), is the principal stock exchange in New …
Read Article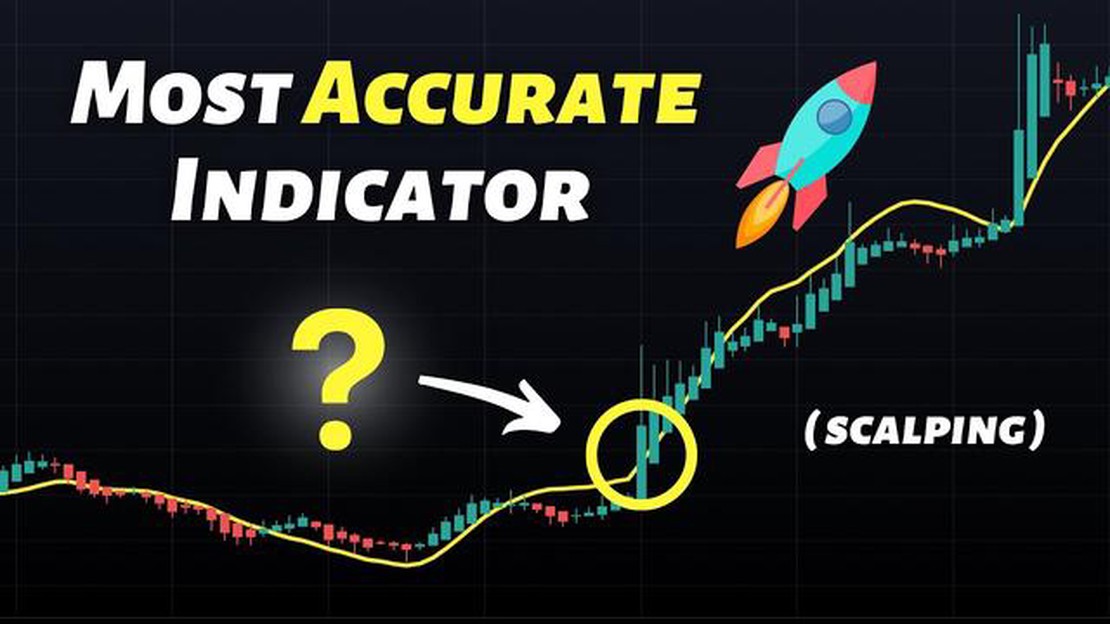
What is the best indicator for a 5 minute chart? When it comes to trading on a 5-minute chart, having a reliable indicator can make all the …
Read Article
Are SPX Index Options Cash Settled? When it comes to options trading, one of the most popular and widely traded products is the SPX index options. But …
Read Article
Los Angeles Dodgers Trade Players to Chicago White Sox? The Los Angeles Dodgers made a bold move in the MLB trade market, with news breaking that they …
Read Article


