


Minimum Account Balance for CMC Markets: Everything You Need to Know
Minimum Account Balance for CMC Markets When it comes to trading with CMC Markets, understanding the minimum account balance requirements is crucial. …
Read Article

The Moving Average (MA) is a widely used technical indicator in financial markets to analyze and predict price trends. It is a mathematical calculation that smooths out price data over a specified period of time, providing a clearer picture of the overall trend. The MA is especially popular among traders and investors who want to identify potential entry and exit points.
In this comprehensive guide, we will delve into the concept of the Moving Average of the Index and explore its significance in financial analysis. Whether you are a seasoned market participant or a novice investor, understanding how the Moving Average works can greatly enhance your decision-making process.
The Moving Average of the Index refers to the calculation of the MA using the price data of a particular market index. Market indices, such as the S&P 500 or Dow Jones Industrial Average, represent a basket of stocks and provide a snapshot of the overall market performance. By applying the Moving Average to an index, investors can gain insights into the general trend of the market and make informed trading decisions.
Traders often use the Moving Average of the Index to identify trend reversals and confirm the strength of a market trend. By comparing the current price to the Moving Average, investors can assess whether the market is in an uptrend, downtrend, or ranging. This information can significantly impact their trading strategies and risk management.
There are different variations of the Moving Average – simple moving average (SMA), exponential moving average (EMA), weighted moving average (WMA), etc. Each type has its own mathematical formula for calculating the average, and traders can choose the one that aligns with their specific needs and trading style.
Through this guide, we will explore the nuances of calculating and interpreting the Moving Average of the Index, as well as its various applications in technical analysis. By gaining a thorough understanding of this powerful indicator, investors can improve their ability to predict market movements and maximize their trading success.
A moving average is a widely used technical analysis tool that helps traders and investors identify trends by smoothing out price data over a specified period of time. There are several types of moving averages, each with its own calculations and uses.
Simple Moving Average (SMA)

The Simple Moving Average (SMA) is the most basic type of moving average. It calculates the average price over a specific number of periods and gives equal weight to each period. For example, a 50-day SMA calculates the average of the 50 most recent closing prices.
Exponential Moving Average (EMA)
The Exponential Moving Average (EMA) is a more advanced type of moving average that gives more weight to recent prices. It uses a calculation that gives greater significance to the most recent data points, making it more responsive to price changes. Traders often use EMAs to get a more accurate picture of short-term trends.
Weighted Moving Average (WMA)
The Weighted Moving Average (WMA) is a type of moving average that assigns different weights to each price in the calculation. The most recent prices are given more weight, while older prices have less impact. This type of moving average is often used to give more importance to recent data while still considering historical prices.
Volume Weighted Moving Average (VWMA)
Read Also: Exploring the Pros and Cons of ESOPs: How Do They Affect Shareholders?
The Volume Weighted Moving Average (VWMA) is a type of moving average that incorporates volume data in its calculation. It gives more weight to periods with higher trading volume, which is believed to represent a higher level of interest and participation. The VWMA is often used to identify periods of strong buying or selling pressure.
Adaptive Moving Average (AMA)
Read Also: Is Trading Options Like Gambling? Debunking Common Misconceptions
The Adaptive Moving Average (AMA) is a type of moving average that automatically adjusts its sensitivity based on the market conditions. It aims to capture changes in volatility and adjust the smoothing factor accordingly. This type of moving average is especially useful in highly volatile markets.
Conclusion
Each type of moving average has its own advantages and implications, and traders choose the one that best suits their trading style and objectives. Whether you’re a short-term trader or a long-term investor, understanding the different types of moving averages can help you make more informed decisions.
Using moving averages is a common and widely used technique in stock market analysis. It is a powerful tool that helps traders and investors to understand the trend and direction of a stock’s price movement. By applying moving averages, market participants can make informed decisions and improve the accuracy of their trading strategies.
There are different ways to apply moving averages in stock market analysis. One popular method is the simple moving average (SMA) which calculates the average price of a stock over a specific period of time. Traders often use the SMA to identify support and resistance levels. When the price of a stock crosses above the SMA, it is considered a bullish signal, suggesting that it may continue to rise. Conversely, when the price crosses below the SMA, it is seen as a bearish signal, indicating that the stock may decline further.
Another commonly used moving average is the exponential moving average (EMA). The EMA is similar to the SMA, but it gives more weight to recent price data, making it more sensitive to recent market changes. Traders use the EMA to identify short-term trends and potential reversals in the stock market. When the price of a stock crosses above the EMA, it is seen as a bullish signal, indicating a potential upward movement. On the other hand, if the price crosses below the EMA, it is considered a bearish signal suggesting a potential downward movement.

Traders can also use moving averages in combination with other technical indicators to enhance their stock market analysis. For example, the Moving Average Convergence Divergence (MACD) combines the EMA with another EMA to generate trading signals. By comparing the MACD line with its signal line, traders can anticipate changes in the direction of a stock’s price movement.
It is important to note that moving averages are not foolproof indicators. They are based on historical price data and may lag behind real-time market conditions. Therefore, it is crucial for traders to combine moving averages with other technical and fundamental analysis tools to make well-informed trading decisions.
In conclusion, the application of moving averages in stock market analysis is a valuable technique for traders and investors. By using moving averages, market participants can identify trends, support and resistance levels, and potential reversals in the stock market. However, it is essential to use moving averages in conjunction with other technical analysis tools and to adapt to market conditions to make successful trading decisions.
The moving average of an index is a statistical calculation that calculates the average price of an index over a specific period of time. It is used to gauge the overall trend of the index and helps in making investment decisions.
The moving average is calculated by taking the sum of the closing prices of an index over a specific period of time and then dividing it by the number of data points used. For example, a 50-day moving average would take the sum of the closing prices of the last 50 trading days and divide it by 50.
The moving average is an important tool in technical analysis as it helps in identifying trends and acts as a support or resistance level for an index. Traders and investors often use the moving average to make buy or sell decisions.
There are different types of moving averages, including the simple moving average (SMA), exponential moving average (EMA), and weighted moving average (WMA). Each type has its own advantages and disadvantages, and traders can choose the one that best suits their trading style.

Minimum Account Balance for CMC Markets When it comes to trading with CMC Markets, understanding the minimum account balance requirements is crucial. …
Read Article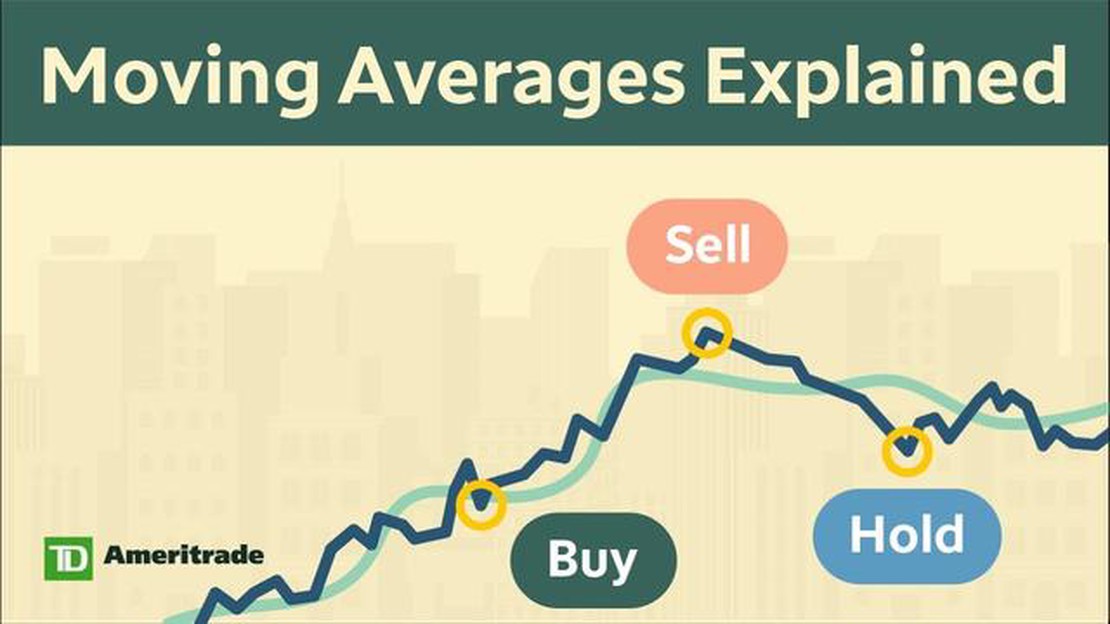
Understanding the 50-Day Moving Average for Silver The 50-day moving average is a widely used technical indicator that provides valuable insights into …
Read Article
What does Bspce stand for? BSPCE stands for Bons de Souscription de Parts de Créateur d’Entreprise, which translates to “Founder Share Subscription …
Read Article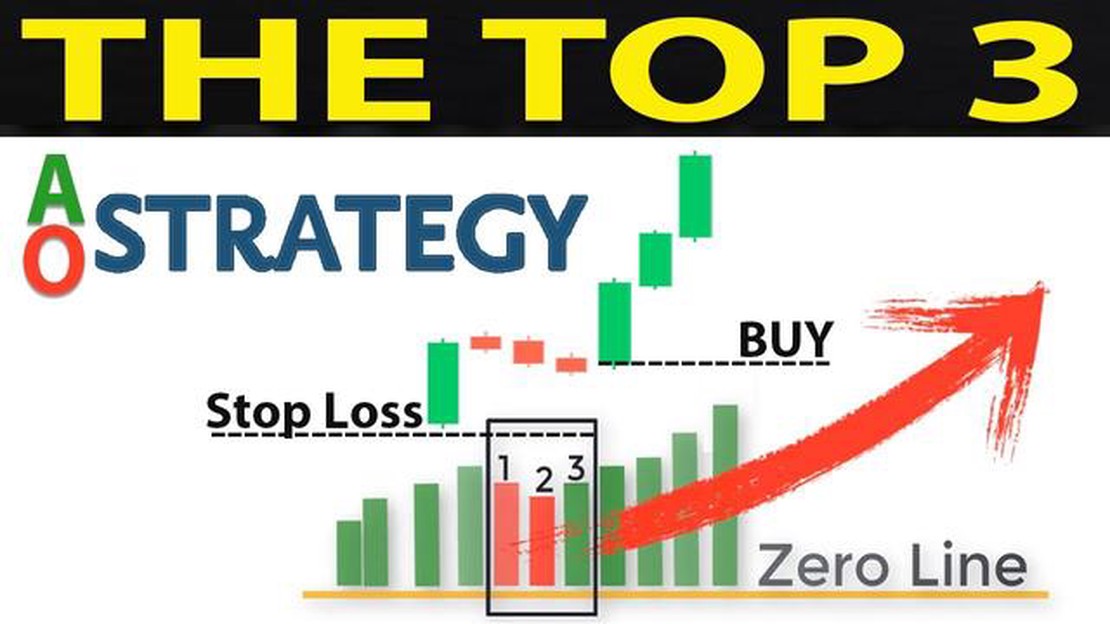
Understanding the Functioning of an Awesome Oscillator The Awesome Oscillator is a technical analysis tool used by traders to identify potential …
Read Article
Step-by-Step Guide to Opening a Forex Trading Account Forex trading is a popular investment option that allows individuals to trade currencies in the …
Read Article
Are Dota 2 Items Trade Locked or Not? In the world of Dota 2, trading and exchanging items between players is a common practice. However, Valve, the …
Read Article


