


How Much Does It Cost to Buy Stock in Nintendo? [2022 Pricing Guide]
Cost to Buy Stock in Nintendo Considering the immense popularity and success of Nintendo in the gaming industry, many investors have been eyeing the …
Read Article
When it comes to technical analysis in the field of finance, moving averages play a crucial role in identifying trends, predicting future price movements, and making informed investment decisions. A moving average is a calculation that smoothes out price data by creating a constantly updated average. It is a widely used tool in understanding the long-term trend of a financial instrument.
In this article, we will delve into the concept of moving averages and explore their application in analyzing the long-term trend of various financial assets. We will discuss different types of moving averages, such as simple moving averages (SMA) and exponential moving averages (EMA), and their respective advantages and limitations.
Furthermore, we will examine the significance of moving averages in identifying support and resistance levels, determining entry and exit points, and generating trading signals. By understanding how moving averages interact with price data, traders and investors can gain valuable insights into the underlying strength and momentum of a market or security.
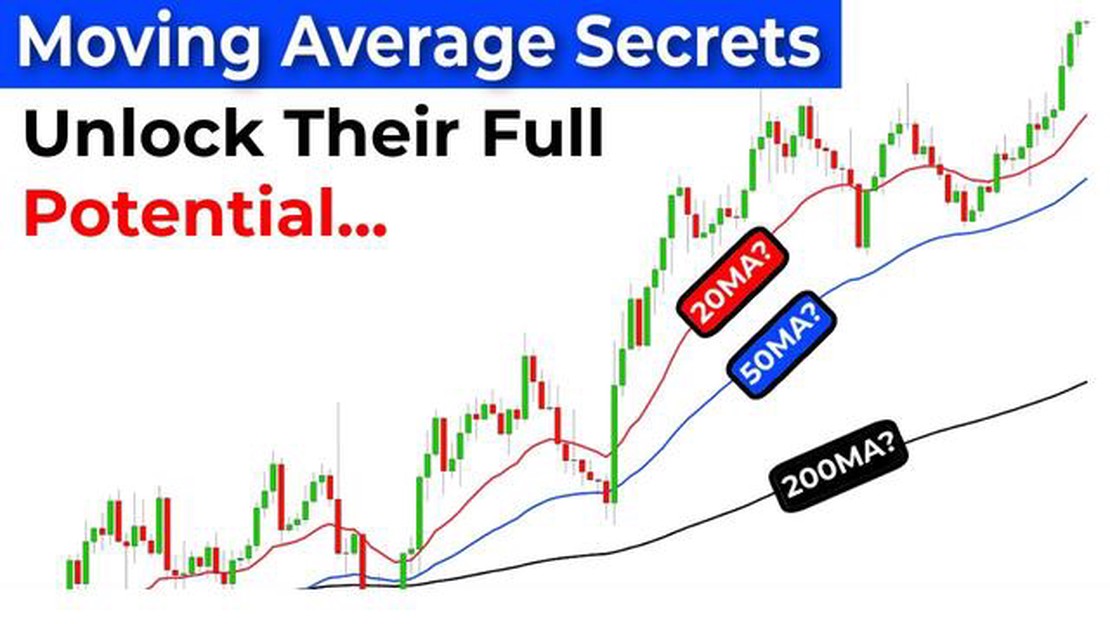
In addition, we will explore the use of longer period moving averages, such as the 50-day and 200-day moving averages, in identifying the long-term trend of a financial instrument. These longer-term moving averages provide a broader perspective on price movements and can be used to confirm or challenge shorter-term trends.
By studying the long-term trend in moving averages, traders and investors can gain a deeper understanding of market dynamics and make more informed decisions. Whether you are a technical analyst or a long-term investor, incorporating moving averages into your analysis can be a valuable tool for navigating the complexities of the financial markets.
In financial analysis, moving averages are a widely used tool for understanding the long-term trend of a stock or other financial instrument. Moving averages smooth out price data by creating a constantly updated average price over a specific time period. This helps analysts identify general trends and potential levels of support or resistance in the market.
There are several types of moving averages that analysts commonly use, including the simple moving average (SMA) and the exponential moving average (EMA). The SMA is calculated by taking the average of a specified number of prices over a certain time period. The EMA, on the other hand, places more emphasis on recent prices and assigns them a greater weight in the calculation.

Moving averages are often used to generate trading signals. When a short-term moving average crosses above a long-term moving average, it is considered a bullish signal, indicating that the stock price may continue to rise. Conversely, when a short-term moving average crosses below a long-term moving average, it is considered a bearish signal, indicating that the stock price may continue to fall.
| Moving Average Type | Calculation |
|---|---|
| Simple Moving Average (SMA) | Sum of Prices / Number of Periods |
| Exponential Moving Average (EMA) | {Current Price - Previous EMA} x (2 / Number of Periods) + Previous EMA |
It is important to note that moving averages should not be used as standalone indicators for making investment decisions. They are best used in conjunction with other technical analysis tools and fundamental analysis. Additionally, it’s important to consider the time period and type of moving average being used, as different moving averages may provide different signals.
Overall, moving averages are a valuable tool for understanding the long-term trend in financial markets. By smoothing out price data, they provide analysts with a clearer picture of general market direction and potential levels of support and resistance. When used in conjunction with other analysis techniques, moving averages can help investors make more informed investment decisions.
Read Also: Who Invested in Zocdoc: Investors, Funding Rounds, and Backers
A moving average is a commonly used technical indicator in stock trading that helps smooth out price data to identify trends over a specific time period. By calculating the average of a set number of periods, moving averages provide traders and investors with a clearer picture of price action over time.
There are different types of moving averages, such as the simple moving average (SMA), exponential moving average (EMA), and weighted moving average (WMA). Each type has its own calculation method and can reveal different aspects of price trends.
The simple moving average (SMA) is the most basic type of moving average, calculated by adding up the closing prices of a security over a certain number of periods and then dividing the sum by the number of periods. The SMA is widely used to smooth out short-term fluctuations and provide a clearer indication of the overall trend.
The exponential moving average (EMA) is similar to the SMA, but it gives more weight to recent price data. Instead of giving equal weight to each period, the EMA places more emphasis on the most recent data points. This makes the EMA more responsive to recent price changes and better suited for shorter-term analysis.
Read Also: Does Questrade Allow Options Trading? | Everything You Need to Know
The weighted moving average (WMA) is similar to the SMA and EMA, but it assigns different weights to each data point. The weighted moving average is commonly used in technical analysis to assign more weight to recent data points, resulting in a smoother line that responds more quickly to recent price changes.
Moving averages can be used in a variety of ways in stock trading and investing. They can be used to identify potential trend reversals, determine support and resistance levels, and generate buy or sell signals. Traders often use moving averages in combination with other technical indicators to confirm signals and make more informed trading decisions.
It is important to note that moving averages are lagging indicators, meaning they reflect past price data and may not accurately predict future price movements. Therefore, it is essential to use moving averages alongside other technical indicators and fundamental analysis to make well-informed trading decisions.
Moving averages are used in trend analysis to smooth out short-term fluctuations and identify the overall direction of the price movement. They provide a simplified representation of the price data over a specified period of time, making it easier for analysts to spot trends and make informed decisions.

The main difference between a simple moving average (SMA) and an exponential moving average (EMA) lies in the way they calculate the average. While SMA gives equal weight to all data points in the period, EMA gives more weight to recent data, making it more responsive to price changes. EMA is often preferred by traders who want to quickly identify trend reversals.
No, moving averages alone cannot predict future price movements. They are primarily used to analyze past and current price data and identify trends. However, some traders use moving average crossovers or other technical indicators in conjunction with moving averages to make predictions about future price movements.
Some commonly used moving averages in trading are the 50-day, 100-day, and 200-day moving averages. The 50-day moving average is often used to identify short-term trends, while the 100-day and 200-day moving averages are used to identify long-term trends. Traders may also use different combinations of moving averages to create trading strategies.
While moving averages can be useful for trend analysis, they have some drawbacks. First, they are lagging indicators, meaning they reflect past price data. This can potentially lead to delayed signals. Second, moving averages may not work well in choppy or sideways markets where there is no clear trend. Traders should use other technical indicators and analysis tools in conjunction with moving averages to get a more comprehensive picture of the market.
A moving average is a commonly used statistical calculation that helps identify trends over a specific period of time. It is calculated by taking the average value of a set of data points over a specified time frame. Moving averages are often used in technical analysis of financial markets to smooth out price fluctuations and determine potential support and resistance levels.
The long-term trend in moving averages is important because it provides insight into the overall direction of a market or security over an extended period of time. By analyzing the long-term trend, traders and investors can identify potential buying or selling opportunities, determine the strength of a trend, and make more informed decisions about when to enter or exit a position.

Cost to Buy Stock in Nintendo Considering the immense popularity and success of Nintendo in the gaming industry, many investors have been eyeing the …
Read Article
Why Does Forex Say Not Enough Money? Forex, or the foreign exchange market, is a popular platform for trading currencies. Many people are attracted to …
Read Article
Trade in France: Opportunities and Challenges France, renowned for its rich history, culture, and gastronomy, is also a hub of international trade. …
Read Article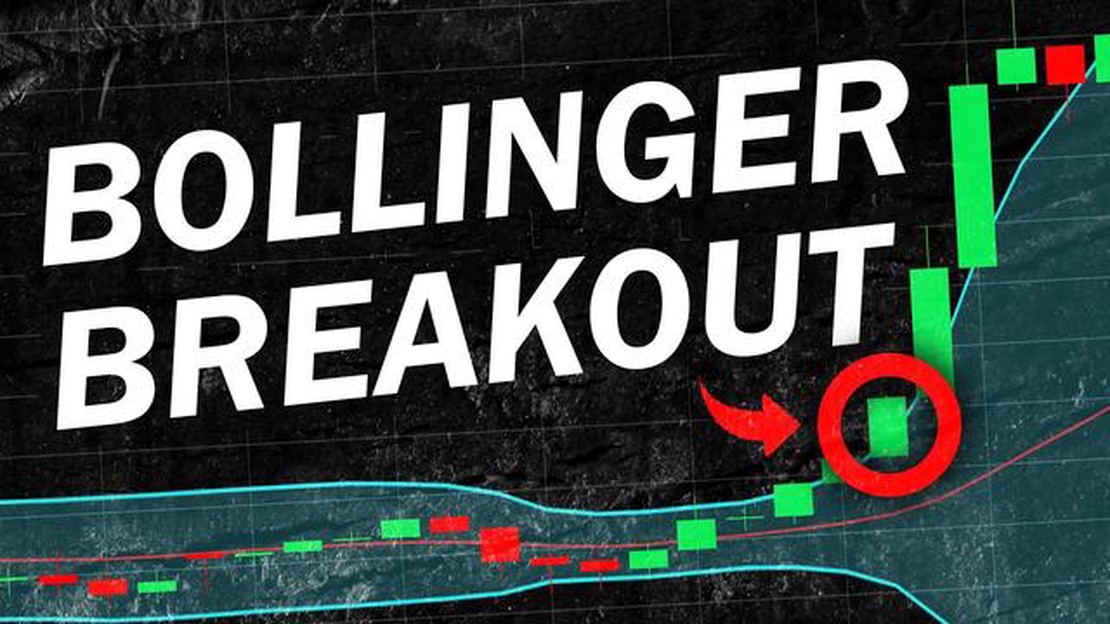
How to Predict Bollinger Band Breakouts The Bollinger Bands indicator, developed by John Bollinger in the 1980s, is widely used by traders and …
Read Article
Disadvantages of gold futures Gold futures have long been considered a popular investment choice due to their potential for high returns. However, it …
Read Article
Is spread on MT4 in pips? When trading on the MT4 platform, one of the key factors to consider is the spread. The spread refers to the difference …
Read Article


