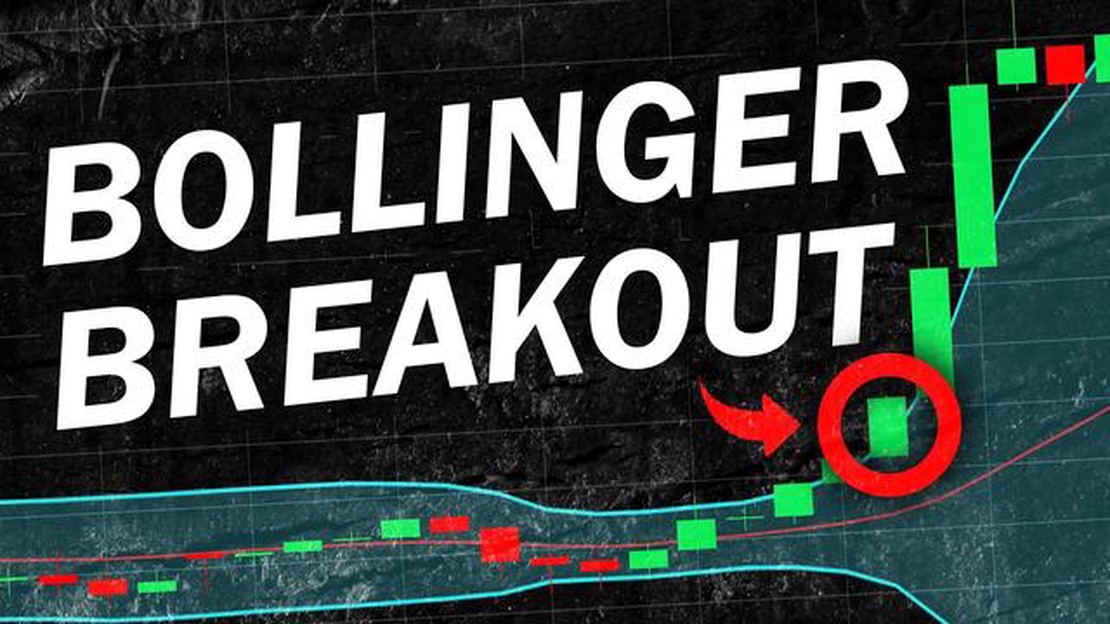
The Bollinger Bands indicator, developed by John Bollinger in the 1980s, is widely used by traders and analysts to identify potential breakouts in financial markets. These bands consist of a moving average line in the center and two outer bands that represent the standard deviation of price movements. When the price moves outside the outer bands, it is considered a breakout signal.
Identifying and predicting these breakouts can be an essential tool for traders looking to capitalize on both short-term and long-term price movements. However, it requires careful analysis and the implementation of effective strategies and techniques. This article explores various methods to help traders identify and make accurate predictions using Bollinger Bands.
Table Of Contents
One popular strategy is the Bollinger Squeeze, which occurs when the bands narrow, indicating low volatility in the market. Traders observe this squeeze as a potential precursor to a breakout. By paying attention to other technical indicators, such as volume or momentum oscillators, traders can further confirm their predictions and make informed trading decisions.
Additionally, understanding the concept of reversion to the mean is crucial when predicting Bollinger Band breakouts. Reversion to the mean suggests that once the price moves outside the bands, it is likely to return to the average. Traders can take advantage of this phenomenon by placing trades accordingly and setting appropriate stop-loss orders to manage risk.
While Bollinger Bands can be a powerful tool for predicting breakouts, it is essential to combine them with other technical analysis tools and market indicators. By doing so, traders can increase the accuracy of their predictions and make more informed trading decisions. This article aims to provide a comprehensive guide to help traders effectively predict Bollinger Band breakouts and maximize their profits in the financial markets.
Identifying Breakout Signals in Bollinger Bands
The Bollinger Bands indicator is a popular technical analysis tool used to identify potential breakout signals in financial markets. Developed by John Bollinger, the indicator consists of a middle band, an upper band, and a lower band. The middle band is usually a simple moving average, while the upper and lower bands are typically set at two standard deviations away from the middle band.
Breakouts occur when the price breaks above the upper band or below the lower band. These breakouts are significant because they suggest a shift in market dynamics and can potentially lead to strong trends and profitable trading opportunities.
There are several ways to identify breakout signals in Bollinger Bands:
A Bollinger Squeeze occurs when the distance between the upper and lower bands narrows, indicating a period of low volatility. This suggests that a breakout may be imminent as volatility often follows periods of consolidation. Traders can look for a tightening of the bands and prepare for a potential breakout when the price breaks above the upper band or below the lower band.
2. Band Expansions:
Band expansions happen when the price breaks above the upper band or below the lower band, indicating increased volatility and potential breakout opportunities. Traders can watch for these expansions as a signal to enter the market in the direction of the breakout.
3. Price Reversals:
Breakouts can also occur when the price reverses after touching or penetrating the upper or lower band. This can be a sign of a potential trend reversal or continuation, depending on the context. Traders can monitor for these reversals and use them as entry or exit signals.
It is important to note that breakouts can sometimes lead to false signals. Therefore, it is crucial to combine Bollinger Bands with other technical indicators and analysis techniques to confirm the validity of breakout signals before making trading decisions.
In conclusion, identifying breakout signals in Bollinger Bands can be a valuable strategy for traders looking to capitalize on market trends and profit from price movements. By observing the Bollinger Squeeze, band expansions, and price reversals, traders can enhance their trading strategies and improve their chances of successful trading.
Effective Strategies for Trading Bollinger Band Breakouts
Trading Bollinger Band breakouts can be a profitable strategy for both beginner and seasoned traders. By carefully analyzing the price action around the Bollinger Bands, traders can identify potential breakout opportunities and take advantage of them. Here are some effective strategies to consider when trading Bollinger Band breakouts:
Wait for a period of low volatility: Bollinger Bands are designed to signal periods of high and low volatility. Before looking for breakouts, it is important to identify a period of low volatility when the Bollinger Bands are contracting. This indicates that the price is consolidating and a breakout is likely to occur soon.
Identify the direction of the breakout: Once a period of low volatility is identified, traders need to determine the direction in which the breakout is likely to occur. This can be done by analyzing the price action and looking for signs of bullish or bearish momentum. Traders can use indicators such as moving averages or trend lines to help confirm the direction of the breakout.
Set entry and exit levels: After identifying the direction of the breakout, traders can set their entry and exit levels. The entry level should be set slightly above the upper Bollinger Band for a bullish breakout, or slightly below the lower Bollinger Band for a bearish breakout. The exit level can be set based on the trader’s risk tolerance or using a trailing stop loss.
Manage risk: Risk management is a crucial aspect of trading any strategy, including Bollinger Band breakouts. Traders should always use stop loss orders to limit their losses in case the breakout fails. They can also consider using position sizing techniques to ensure that their risk is properly managed.
Practice patience and discipline: Trading breakouts requires patience and discipline. Not every breakout will be successful, and it is important to avoid chasing trades or taking unnecessary risks. Traders should stick to their strategy and wait for high-probability setups before entering a trade.
By following these effective strategies, traders can increase their chances of success when trading Bollinger Band breakouts. However, it is important to note that no strategy guarantees profits, and traders should always be prepared for potential losses. It is recommended to backtest and practice the strategies in a demo account before trading with real money.
FAQ:
What are Bollinger Bands?
Bollinger Bands are a technical analysis tool that consists of a moving average and two standard deviation lines plotted above and below it. They are used to measure volatility and identify potential breakout opportunities.
How do you calculate Bollinger Bands?
Bollinger Bands are calculated by taking a simple moving average of a stock’s closing prices over a certain time period, typically 20 days, and then adding and subtracting two standard deviations from the moving average.
What is a Bollinger Band breakout?
A Bollinger Band breakout occurs when the price of a stock or security breaks above or below the upper or lower band. This is often a sign of increased volatility and can be an indication of a trend reversal or a potential trading opportunity.
What are some strategies for predicting Bollinger Band breakouts?
There are several strategies that traders use to predict Bollinger Band breakouts. One common approach is to wait for the price to close above or below the band and then enter a trade in the direction of the breakout. Another strategy involves using additional indicators, such as the relative strength index (RSI), to confirm the breakout signal.
Exponentially Weighted Moving Average Charts for Monitoring the Process Mean Process mean monitoring is an essential step in ensuring the quality and …
Is intraday or options trading more profitable? When it comes to investing in the stock market, there are several strategies that traders can employ. …
Understanding the Profit Sharing Program in Brazil: Benefits and Regulations Profit sharing programs are becoming increasingly popular in Brazil as a …