

Understanding Forex in Geography: Definition, Importance, and Applications
Forex in Geography: Understanding the Foreign Exchange Market Forex, or foreign exchange, plays a vital role in geography. Forex refers to the global …
Read Article
When it comes to analyzing trends in data, one useful tool is the centered moving average. This statistical technique allows us to smooth out any fluctuations in a data set and identify long-term trends or patterns. In this article, we will delve into the concept of centered moving average and understand how it can be applied in various domains.
A centered moving average is calculated by taking the average of a group of data points, where the selected point is the center of the group. By using this method, we can reduce the impact of outliers and random fluctuations that may distort our interpretation of the underlying trend. This makes centered moving average a valuable tool in statistical analysis, econometrics, and financial forecasting.
To illustrate the concept, let’s consider an example. Imagine we have a monthly sales data for a retail store over the course of several years. By applying centered moving average with a window size of 12 months, we can identify the seasonal patterns and long-term trends in the sales data. This information can then be used to make informed decisions about inventory management, pricing strategies, and resource allocation.
In conclusion, centered moving average is a powerful statistical technique that helps us understand the underlying trends in a data set. By smoothing out fluctuations and identifying patterns, it enables us to make informed decisions and predictions in various domains. Whether you are analyzing stock market trends or predicting customer behavior, centered moving average can be a valuable tool in your data analysis toolkit.
The centered moving average (CMA), also known as the centered moving average, is a common statistical technique used to analyze time series data. It is a type of moving average where each data point in the time series is replaced by the average of a set of neighboring data points.
The key difference between the centered moving average and other types of moving averages is that in CMA, the average is calculated using an equal number of data points on both sides of the point being averaged. This means that each data point in the time series is given equal importance, and the average is centered around the data point being analyzed.
The CMA is particularly useful in smoothing out short-term fluctuations in the time series, thereby highlighting the overall trend or pattern of the data. By calculating the average of neighboring data points on both sides of each data point, the CMA provides a more balanced and centered view of the time series.

The CMA is commonly used in various fields such as finance, economics, and climate science to analyze and forecast time series data. It is especially effective when there is no strong trend or seasonality present in the data, as it helps to remove random fluctuations and noise.
| Time Point | Data Value | CMA Value |
|---|---|---|
| t-2 | 8 | 14 |
| t-1 | 15 | |
| t | 10 | |
| t+1 | 12 | 11.33 |
| t+2 | 13 | |
| t+3 | 9 |
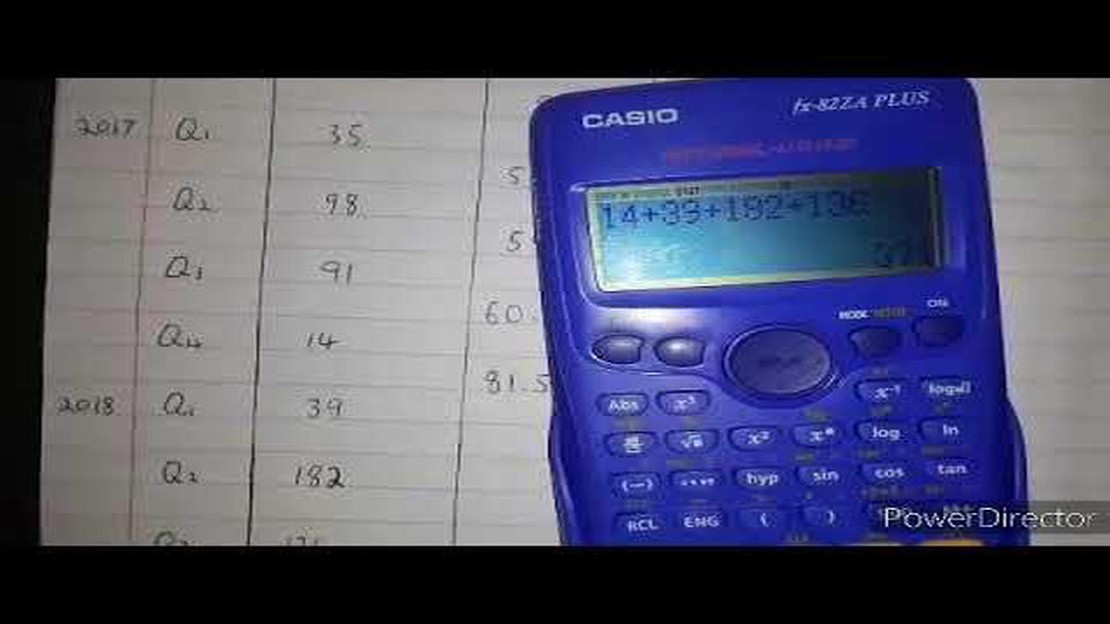
For example, consider the time series data shown in the table above. The CMA value for each data point is calculated by taking the average of the three neighboring data points (two on the left and two on the right). This helps to smooth out the fluctuations in the data and provides a more centered view of the overall trend.
Read Also: Do Banks Offer Forex Services? Learn About Banking and Forex Trading
In conclusion, the centered moving average is a powerful statistical technique that is used to analyze time series data. It helps to remove short-term fluctuations and noise, highlighting the underlying trend or pattern in the data. By equalizing the importance of each data point and centering the average, the CMA provides a balanced view of the time series. It is widely used in various fields and can be a valuable tool for forecasting and analysis.
The concept of centered moving average is an important tool in the field of data analysis and time series forecasting. It is widely used to smooth out data and identify trends or patterns that may be hidden in the raw data.
One of the main reasons why centered moving average is important is that it helps to remove the noise or fluctuations from the data. By taking the average of a set of data points within a specified window, centered moving average provides a smoothed representation of the underlying data. This is particularly useful when dealing with noisy or erratic data sets.
Another reason why centered moving average is important is its ability to highlight trends or patterns in the data. By smoothing out short-term fluctuations and focusing on the overall trend, centered moving average can help analysts identify long-term patterns and make more accurate forecasts.
Centered moving average is also frequently used for outlier detection. By comparing the actual data values with the centered moving average values, analysts can easily spot any data points that deviate significantly from the expected pattern. This makes it a valuable tool for quality control and anomaly detection.
Overall, centered moving average is an important concept in data analysis, forecasting, and trend detection. It helps to reduce noise, identify trends, and detect outliers in data sets, making it a valuable tool for analysts and researchers in various fields.
The centered moving average (CMA) is a statistical technique used to smooth out fluctuations in time series data. It calculates the average value of a specified number of data points, with each data point weighted equally. The “centered” aspect of the moving average refers to the fact that the average is calculated based on a window of data points that includes the current data point as well as an equal number of data points before and after it.
To calculate the centered moving average, you first need to specify the number of data points to be included in the moving average window, often referred to as the “window size” or “lag”. This window size should be an odd number to ensure that the current data point is included in the center of the window.
Read Also: Forex Card vs Cash: Which Payment Option is Superior?
The CMA is calculated by taking the sum of the data points within the window and dividing it by the window size. This average is then assigned to the central data point of the window. As new data points become available, the window “moves” along the time series, recalculating the average for each new data point.
The main purpose of using the centered moving average is to reduce the impact of random fluctuations and noise in the data, making it easier to identify underlying patterns or trends. By smoothing out these short-term variations, the CMA provides a clearer representation of the overall trend or direction of the data.
It’s important to note that the centered moving average may introduce a lag in the data, as the average is calculated based on past data points. This lag can affect the accuracy of predictions or forecasts based on the moving average. Additionally, the choice of window size can impact the effectiveness of the CMA in smoothing out fluctuations – smaller window sizes may result in a more responsive average, but it may miss out on long-term trends, while larger window sizes may provide better trend identification but might smooth out too much of the short-term variations.

In conclusion, the centered moving average is a useful tool for smoothing out time series data and identifying trends or patterns. It provides a more stable representation of the data by considering a window of data points centered around each data point. Understanding how the CMA works and its limitations can help in making informed decisions when analyzing and interpreting time series data.
A centered moving average is a type of moving average that calculates the average of a specific number of data points, with the current data point being at the center of the calculation. This helps provide a better representation of the overall trend by reducing lag.
To calculate a centered moving average, you first determine the number of data points you want to use in the calculation (for example, 5). Then, you take the average of the data points before and after the current data point, with the current data point being the center. This process is repeated for each data point.
The main difference between a centered moving average and a simple moving average is the positioning of the current data point in the calculation. In a simple moving average, the current data point is at the end of the calculation, while in a centered moving average, it is in the middle. This helps reduce lag and provides a better representation of the overall trend.
Using a centered moving average can provide a smoother representation of the data compared to other types of moving averages, as it reduces lag. It also helps highlight the overall trend more effectively by giving equal weight to data points on both sides of the current point. This can be particularly useful when analyzing time series data or when identifying trends in financial markets.

Forex in Geography: Understanding the Foreign Exchange Market Forex, or foreign exchange, plays a vital role in geography. Forex refers to the global …
Read Article
Money Flow Index Indicator: How to Use It The Money Flow Index (MFI) is a popular technical indicator used by traders to analyze the momentum and …
Read Article
Is Czarina Foreign Exchange legit? When it comes to foreign exchange, it’s essential to find a reliable and trustworthy company. One such company that …
Read Article
What is a portfolio in trading? When it comes to trading, having a well-diversified portfolio is key to success. But what exactly is a portfolio in …
Read Article
Understanding the Significance of Weekly Options Trading Weekly options trading can be an exciting and potentially profitable venture for investors …
Read Article
Is IQ Option a Good Trading Platform? IQ Option has gained significant recognition as a popular online trading platform. It offers a wide range of …
Read Article

