


Can you day trade oil futures? Tips for successful day trading in oil futures
Is Day Trading Oil Futures Possible? Day trading oil futures can be a lucrative and exciting venture for those who are willing to put in the time and …
Read Article

Forex trading is a complex and dynamic market, with countless factors influencing the rise and fall of currency prices. Traders use a variety of tools and strategies to make informed decisions, one of which includes chart patterns. These patterns are formed by the price movement of a currency pair over time, and they can provide valuable insights into future price movements.
Among the many chart patterns that traders analyze, one of the most common and widely recognized is the head and shoulders pattern. This pattern resembles a person’s head and shoulders and typically indicates a reversal in the current trend. It consists of three main components: a left shoulder, a head, and a right shoulder. The left shoulder is formed when the price reaches a high point, followed by a decline. The head is formed when the price reaches a higher peak than the left shoulder, followed by another decline. Finally, the right shoulder is formed when the price reaches a lower peak than the head, followed by a decline.
Traders often view the head and shoulders pattern as a signal to sell, as it suggests that the current uptrend is coming to an end and a downward trend is about to begin. This pattern is considered reliable because it reflects a change in market sentiment, with buyers losing their conviction and sellers gaining control. Once the right shoulder is formed and the price breaks below the neckline (a line connecting the lows of the left shoulder and the head), traders may enter a short position, anticipating further price declines.
However, it’s important for traders to remember that chart patterns should not be used in isolation and should be confirmed with other technical indicators and analysis. The head and shoulders pattern is just one piece of the puzzle, and market conditions can vary greatly. Traders should always consider factors such as volume, support and resistance levels, and overall market trend before making any trading decisions.
In conclusion, the head and shoulders pattern is a common and reliable chart pattern in forex trading. It can provide valuable insights into upcoming price movements and is often used by traders to anticipate trend reversals. However, caution should be exercised, and traders should use this pattern in conjunction with other analysis tools to make well-informed trading decisions.
Chart patterns play a crucial role in forex trading as they provide valuable insights into the market’s behavior and help traders identify potential trading opportunities. These patterns are formed by a series of price movements and can indicate the continuation or reversal of market trends.

By understanding and recognizing chart patterns, forex traders can make informed decisions and develop effective trading strategies. Chart patterns can be used to identify support and resistance levels, determine entry and exit points, and assess risk-reward ratios.
One of the most common chart patterns in forex trading is the double top or double bottom pattern. This pattern consists of two peaks or valleys that are approximately equal in height, followed by a reversal in the market direction. Traders often use this pattern to confirm trend reversals and plan their trades accordingly.
Another popular chart pattern is the head and shoulders pattern. This pattern consists of three peaks, with the middle peak being higher than the other two. It signals a potential trend reversal, with the market shifting from an uptrend to a downtrend or vice versa. Forex traders often use this pattern to determine entry and exit points, as well as to set stop-loss orders.
Chart patterns can also provide valuable information about market sentiment and investor psychology. For example, a symmetrical triangle pattern indicates a period of consolidation, where buyers and sellers are in equilibrium. This pattern often precedes a significant breakout, and forex traders use it to gauge potential market direction.
Read Also: Exploring the Effectiveness of Candlestick Patterns in the Stock Market
In conclusion, chart patterns are essential tools in forex trading as they help traders identify potential trading opportunities, determine market direction, and manage risk. By understanding and recognizing these patterns, traders can make informed decisions and increase their chances of success in the forex market.
Recognizing chart patterns is essential for successful forex trading. Chart patterns are repetitive formations that occur on forex price charts, and they can provide valuable insight into future price movements.
Read Also: Understanding Income for Child Support in California
Here are some commonly observed chart patterns that traders use to make informed trading decisions:
When recognizing chart patterns, it’s important to also consider other technical analysis tools, such as support and resistance levels, trendlines, and indicators. Combining these tools can provide a more comprehensive view of the market and increase the likelihood of making successful trades.
Remember, chart patterns are not foolproof indicators, and it’s crucial to use them in conjunction with other forms of analysis and risk management strategies. Practice identifying chart patterns and analyzing their implications to improve your chances of success in forex trading.
The most common chart pattern in forex trading is the triangle pattern.

The triangle pattern is formed when the price consolidates between two converging trendlines. It can be classified into three types: ascending triangles, descending triangles, and symmetrical triangles.
An ascending triangle is a bullish chart pattern. It is formed when the price consolidates between a horizontal resistance line and a rising trendline. Traders expect the price to break out above the resistance line and continue the upward move.
A descending triangle is a bearish chart pattern. It is formed when the price consolidates between a horizontal support line and a descending trendline. Traders expect the price to break out below the support line and continue the downward move.
A symmetrical triangle is a neutral chart pattern. It is formed when the price consolidates between a descending trendline and a ascending trendline. Traders expect the price to break out in either direction and continue the move in that direction.
A chart pattern in forex trading is a recognizable formation on a price chart that suggests a potential future price movement.

Is Day Trading Oil Futures Possible? Day trading oil futures can be a lucrative and exciting venture for those who are willing to put in the time and …
Read Article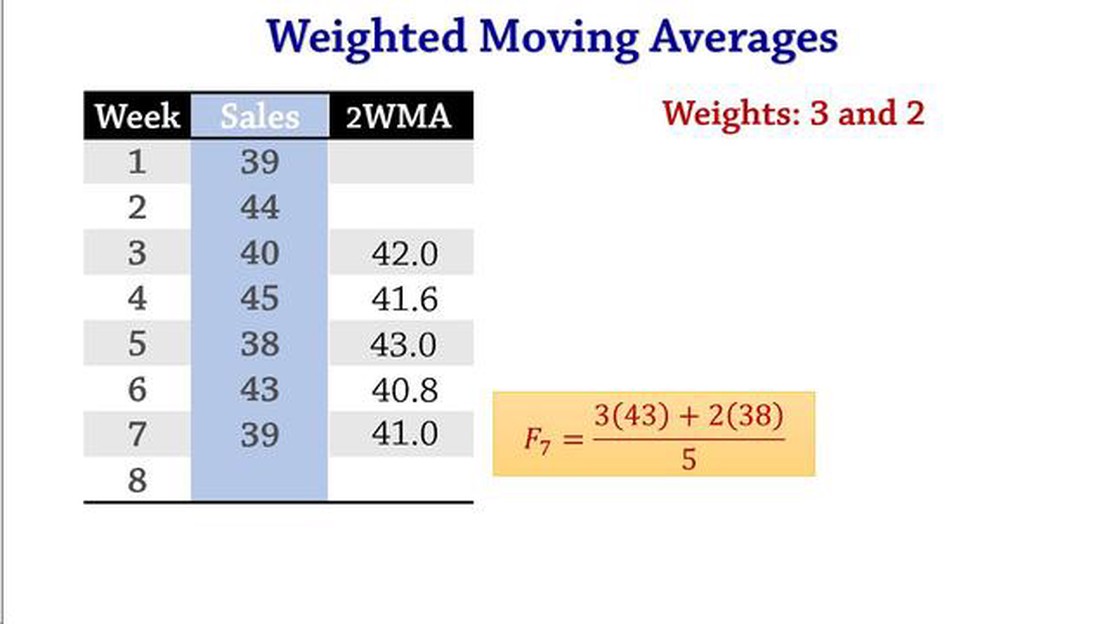
Guide to Weighted Moving Average Forecasting Accurate forecasting is crucial for businesses in making informed decisions and planning for the future. …
Read Article
Understanding Forex ATR Values When it comes to trading in Forex markets, understanding and managing risk is crucial. One key measure that traders use …
Read Article
Mastercard Stock Options: What You Need to Know Stock options are a common way for companies to incentivize their employees and align their interests …
Read Article
What is the relationship between ICE and NYSE? The Intercontinental Exchange (ICE) and the New York Stock Exchange (NYSE) are two powerhouse entities …
Read Article
What is GID in Morgan Stanley? In the world of finance, understanding the various terminologies and acronyms is crucial. One such term that is often …
Read Article


