

Understanding the CNY to USD Spot Exchange Rate: All You Need to Know
What is the CNY to USD spot rate? When it comes to international trade and finance, one of the most important factors to consider is the exchange rate …
Read Article
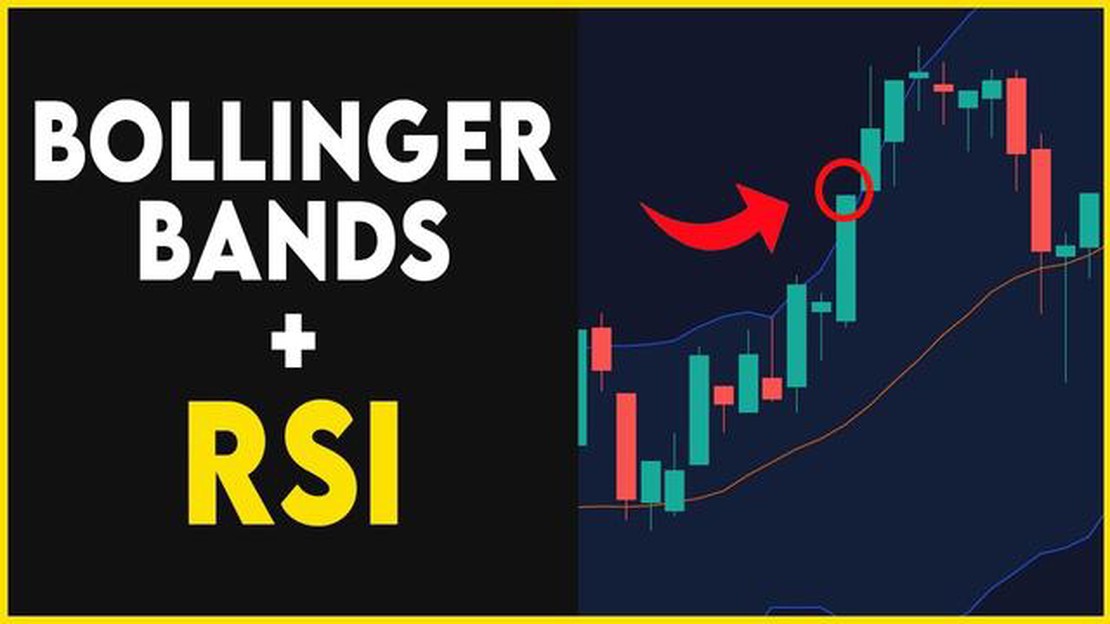
Swing trading is a popular trading style that seeks to capture short-term market movements. Traders who engage in swing trading look for opportunities to profit from price fluctuations within a specific time frame, typically a few days to a few weeks. To effectively identify potential entry and exit points, swing traders utilize various technical analysis tools, including Bollinger Bands.
Developed by John Bollinger in the 1980s, Bollinger Bands are a versatile and widely-used indicator in technical analysis. They consist of three lines: a middle band, which is a simple moving average, and an upper and lower band, which are typically two standard deviations away from the middle band. These bands dynamically adjust to changes in price volatility, expanding during periods of high volatility and contracting during periods of low volatility.
The key feature of Bollinger Bands is that they provide valuable information about price levels that may be overbought or oversold. When the price reaches the upper band, it may indicate that the security is overbought and due for a reversal. On the other hand, when the price reaches the lower band, it may signal that the security is oversold and due for a bounce back.
Traders can also use Bollinger Bands to identify potential trend reversals. If the price pierces through the upper band and then closes below the middle band, it could be a signal of a potential trend reversal from an uptrend to a downtrend. Conversely, if the price breaks through the lower band and then closes above the middle band, it could indicate a potential trend reversal from a downtrend to an uptrend.
It is important to note that Bollinger Bands are not a standalone tool for making trading decisions. Traders should use them in conjunction with other technical indicators and analysis techniques to confirm signals and minimize risk.
In conclusion, Bollinger Bands are a powerful tool for swing traders, providing valuable insights into price levels that may be overbought or oversold and potential trend reversals. By incorporating Bollinger Bands into their trading strategies, swing traders can make more informed decisions and potentially improve their trading performance.
Swing trading is a popular trading strategy that aims to take advantage of short-term price movements in financial markets. Traders who employ this strategy are constantly on the lookout for reliable indicators and tools that can enhance their decision-making process. Bollinger Bands is one such technical indicator that has gained significant popularity among swing traders.
Bollinger Bands, developed by John Bollinger, are a volatility-based indicator that consists of a middle band, an upper band, and a lower band. The middle band is typically a simple moving average, while the upper and lower bands are drawn at a specific number of standard deviations away from the middle band.
The key benefit of using Bollinger Bands in swing trading is their ability to provide valuable information about market volatility and potential price breakouts. When the volatility is high, the bands widen, indicating a greater potential for price movement. Conversely, when the volatility is low, the bands narrow, suggesting a potential period of consolidation or range-bound trading.

Bollinger Bands also offer valuable insights into potential trend reversals. As prices approach the upper or lower band, it indicates a potential overbought or oversold condition, respectively. This can be an indication of an impending reversal in the price trend, allowing traders to enter or exit positions at opportune moments.
Furthermore, Bollinger Bands can be used in conjunction with other technical indicators to increase the probability of successful trades. For example, combining Bollinger Bands with oscillators like the Relative Strength Index (RSI) or the Stochastic Oscillator can help traders identify potential entry and exit points with higher confidence.
However, it is crucial to remember that no indicator or trading strategy is foolproof. Bollinger Bands should be used as a tool to support and confirm other technical and fundamental analysis. Traders need to consider other factors such as market conditions, economic news, and risk management principles to make informed decisions.
In conclusion, Bollinger Bands can be an essential tool in a swing trader’s arsenal. They provide valuable insights into market volatility, potential trend reversals, and can be used in conjunction with other indicators for enhanced decision-making. By understanding the benefits and limitations of Bollinger Bands, traders can effectively utilize this technical indicator to improve their swing trading strategies.
Read Also: Calculating seasonal indexes with the moving average method
Swing trading is a popular trading strategy that focuses on capturing short-term price movements. Traders who employ swing trading techniques aim to identify and capitalize on market trends and reversals within a relatively short time frame, typically a few days to a few weeks.
One of the main strategies used in swing trading is trend following. Traders analyze historical price data to identify market trends and enter trades in the direction of the prevailing trend. This strategy involves buying when the price is trending upward and selling when the price is trending downward.
Read Also: Reporting Non-Qualified Stock Options: A Complete Guide
Another popular swing trading strategy is range trading. In this strategy, traders identify support and resistance levels on a price chart and enter trades when the price bounces off these levels. Range traders aim to profit from the price fluctuations within a defined trading range.
Breakout trading is also commonly used in swing trading. Traders wait for a significant breakout above resistance or below support levels before entering trades. Breakout traders aim to catch large price moves that occur after a period of consolidation or range-bound trading.
Swing traders often use technical indicators to help identify potential trading opportunities. One widely used indicator is the Bollinger Bands. Bollinger Bands are plotted on the price chart and consist of a moving average line and two standard deviation lines. Traders use Bollinger Bands to identify overbought or oversold conditions and to determine potential entry and exit points.
Risk management is essential in swing trading. Traders should establish clear stop-loss orders to limit potential losses and set profit targets to lock in gains. Additionally, position sizing should be carefully considered to ensure proper risk management.

Overall, swing trading offers traders the opportunity to profit from short-term price movements. Understanding and implementing various swing trading strategies and techniques, such as trend following, range trading, and breakout trading, can help traders improve their chances of success in the market.
| Pros of Swing Trading | Cons of Swing Trading |
|---|---|
| * Potential for quick profits |
Bollinger Bands are a technical analysis tool that consists of a moving average and two standard deviation bands above and below it. They are used to measure the volatility and identify potential reversal points in a stock or other financial instrument’s price.
Bollinger Bands can help in swing trading by providing traders with information about possible overbought or oversold conditions. When the price touches or moves beyond the upper band, it may be a sign of overbought conditions and a potential reversal to the downside. On the other hand, when the price touches or moves beyond the lower band, it may be a sign of oversold conditions and a potential reversal to the upside.
The width of the Bollinger Bands is a measure of volatility. When the bands are narrow, it suggests that the market is experiencing low volatility, and when the bands are wide, it suggests that the market is experiencing high volatility. Traders can use this information to assess the potential profit opportunities and risk levels in swing trading.
Bollinger Bands can be used to analyze the price movements of various financial instruments, including stocks, commodities, and currencies. However, it’s important to note that different instruments may have different characteristics and price patterns, so traders should always consider other factors and use additional technical analysis tools to make trading decisions.
Traders can use various technical indicators alongside Bollinger Bands to enhance their swing trading strategies. Some commonly used indicators include the Relative Strength Index (RSI), Moving Average Convergence Divergence (MACD), and Stochastic Oscillator. These indicators can provide additional insights into the strength of price momentum and potential trend reversals.
Bollinger Bands are a technical analysis tool that consist of a set of lines plotted two standard deviations away from a simple moving average. They are used to determine overbought and oversold levels, as well as price volatility.

What is the CNY to USD spot rate? When it comes to international trade and finance, one of the most important factors to consider is the exchange rate …
Read Article
Is 4GB RAM enough for trading? When it comes to trading, having enough memory is crucial for efficient performance. With the increasing complexity of …
Read Article
Metatrader 4 and Heikin Ashi Candles: A Comprehensive Guide If you’re a trader using Metatrader 4, you may be wondering whether this popular trading …
Read Article
Understanding EA Trades: What They Are and How They Work If you’re new to the world of trading, you may have come across the term “EA trade”. But what …
Read Article
Understanding the Price Action in Forex: A Comprehensive Guide Forex trading is a complex and dynamic market, and price action plays a crucial role in …
Read Article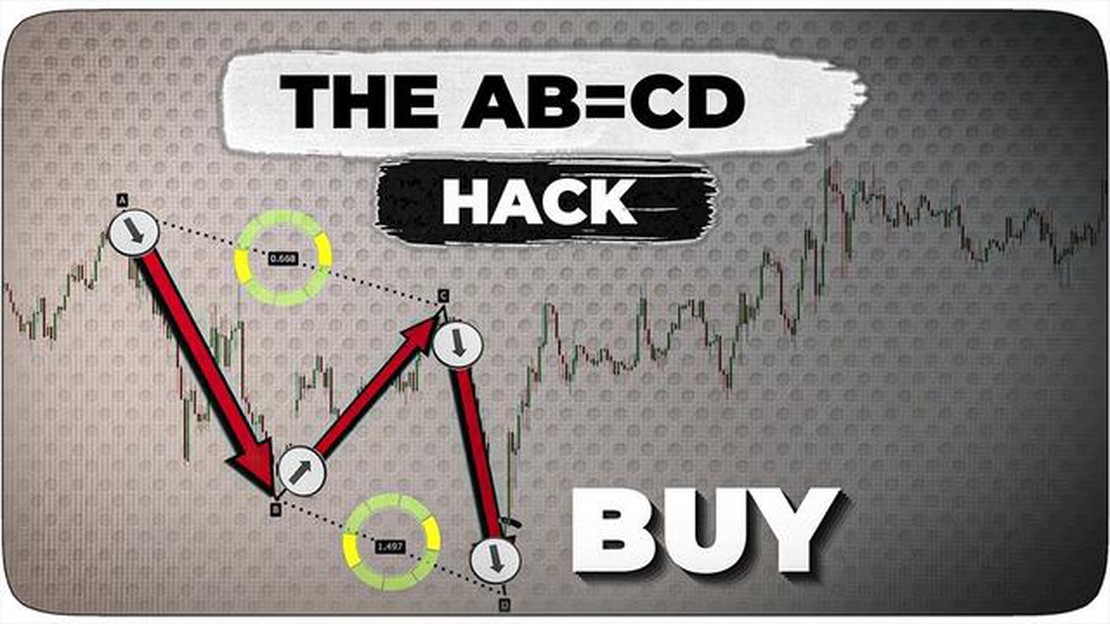
Understanding the ABC Chart Pattern When it comes to technical analysis, chart patterns play a crucial role in predicting future price movements. One …
Read Article


