


Is Crypto the Same as Gambling? Understanding the Similarities and Differences
Is Crypto the Same as Gambling? Both cryptocurrency and gambling involve risk and the potential for financial gain or loss. However, there are …
Read Article
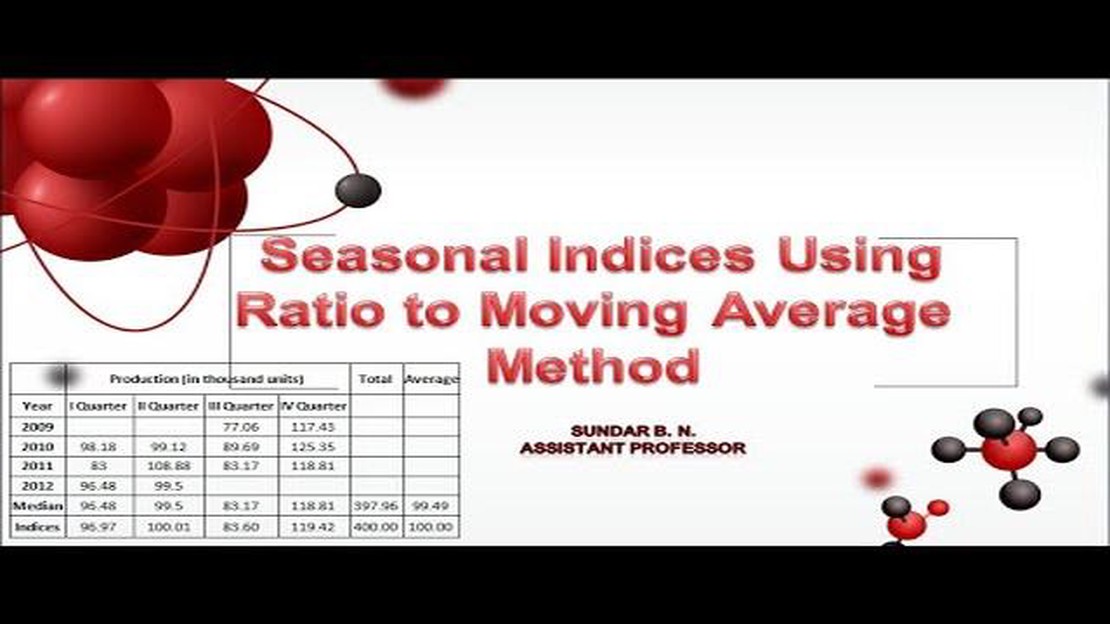
The moving average method is a commonly used technique in statistical analysis for calculating seasonal indexes. Seasonal indexes help to identify recurring patterns or trends in data that occur at regular intervals throughout the year, such as quarterly or monthly. By understanding these patterns, businesses can make more accurate forecasts and predictions for future periods.
In the moving average method, a set of consecutive observations is taken and averaged to calculate a single point. This process is repeated for a specific number of periods, typically three or four, to smooth out any irregularities and highlight the underlying trend. These moving averages can then be compared to the actual values to determine the seasonal pattern.
For example, consider a retail business that wants to analyze their sales data on a monthly basis. By calculating the moving average for each month, they can identify any seasonal variations in sales, such as a spike in sales during the holiday season or a dip in sales during the summer months. This information can help them to better plan inventory, marketing campaigns, and staffing levels throughout the year.
There are several methods for calculating seasonal indexes, including the ratio-to-moving-average method and the deseasonalization method. The moving average method is a simpler and more intuitive approach that can be easily understood and implemented, making it a popular choice for many businesses.
In conclusion, the moving average method is a valuable tool for calculating seasonal indexes. By analyzing the seasonal variations in data, businesses can gain insights into recurring patterns and make more informed decisions. Whether it’s forecasting sales, optimizing production schedules, or planning marketing campaigns, understanding seasonal trends is crucial for success in many industries.
Seasonal indexes, also known as seasonal factors or seasonal coefficients, are values that represent the relative strength of a seasonal pattern in time series data. They are used to quantify and analyze the seasonal fluctuations or patterns that occur regularly within a specific time period, such as a week, month, or year.
Seasonal indexes are often calculated to adjust for the seasonal patterns in a time series, allowing for more accurate forecasting and trend analysis. They provide insight into how a variable, such as sales or production, varies over different time periods throughout the year.

Seasonal indexes are typically expressed as percentages, where 100% represents the average level of the variable during the entire time series. Values above 100% indicate higher-than-average levels, while values below 100% indicate lower-than-average levels.
To calculate seasonal indexes, various methods can be used, including the moving average method, the ratio-to-moving-average method, and the regression method. These methods involve smoothing the data to identify the seasonal patterns and then calculating the seasonal indexes based on the smoothed data.
Once the seasonal indexes are determined, they can be applied to the original data to deseasonalize it. This process involves dividing each observation by the corresponding seasonal index to remove the seasonal component from the data. The deseasonalized data can then be used for further analysis, such as trend estimation or forecasting.
Overall, seasonal indexes are a valuable tool in time series analysis as they allow for a more accurate understanding and interpretation of the seasonal patterns present in the data. They help to identify and quantify the cyclical fluctuations that occur within a specific time period, enabling better forecasting and decision making.
Read Also: How Much Do Options Traders Make in California? Discover Facts and Figures
The moving average method is a statistical technique used to calculate seasonal indexes. It is based on the idea of using a rolling average to smooth out seasonal fluctuations in a time series dataset. By calculating and analyzing the moving averages, analysts can identify and quantify the patterns and trends in the data, helping to make predictions and forecasts.
The moving average method involves calculating the average of a fixed number of consecutive observations in a dataset. This fixed number is referred to as the window or the period. The window size typically depends on the length and the frequency of the seasonal pattern being analyzed. For example, a monthly seasonal pattern might have a window size of 12 for a one-year period.
To calculate the moving average, you sum up the values in the window and divide by the window size. This calculation is repeated for each consecutive window in the dataset, resulting in a series of moving average values. These values are then used to determine the seasonal indexes.
The seasonal indexes are ratios that express the relative importance of each season in the time series dataset. They help to compare the observed values against the expected values for each season. To calculate the seasonal indexes using the moving average method, the observed values for each season are divided by the corresponding moving average value for that season.
Read Also: Where to Exchange UAE Money: Best Places to Convert Currency
Once the seasonal indexes are calculated, they can be used to deseasonalize the data. Deseasonalization is the process of removing or adjusting for the seasonal component in the dataset, allowing for a clearer analysis of the underlying trend and other components. This deseasonalized data can then be used for further analysis, such as forecasting or identifying irregularities.
The moving average method is widely used in various industries and fields, including finance, economics, and marketing. It provides a simple yet effective way to understand and analyze seasonal patterns in time series data, helping to inform decision-making and planning.
| Advantages | Disadvantages |
|---|---|
| Easy to understand and implement | May smooth out important irregularities |
| Helps identify and quantify seasonal patterns | May not capture abrupt changes or shifts |
| Aids in making predictions and forecasts | Requires determining appropriate window size |
Calculating seasonal indexes is important because it can help in identifying and understanding seasonal patterns in data. By understanding these patterns, businesses can make more informed decisions regarding staffing, inventory management, and promotional activities, among other things.

To calculate seasonal indexes, you can use the moving average method. This method involves taking the average of a specific number of periods, usually in the same season, and then dividing the actual value for each period by the corresponding moving average. This will give you the seasonal index for each period, which can be used to adjust the data for seasonal effects.
The moving average method is a technique used to identify and analyze patterns or trends in data. It involves calculating the average of a specific number of periods, usually in the same season, and using that average as a representative value for the period. This helps to smooth out any random fluctuations in the data and make it easier to identify underlying patterns.
You can use seasonal indexes in forecasting by applying them to the historical data to account for seasonal patterns. Once you have calculated the seasonal indexes, you can multiply them by the corresponding values in your historical data to adjust for seasonal effects. This adjusted data can then be used to make more accurate forecasts by taking into account the expected seasonal variations.
Yes, there are some limitations to using the moving average method for calculating seasonal indexes. One limitation is that it assumes the underlying pattern is a constant average over time, which may not always be the case. It also tends to smooth out any short-term fluctuations and may not pick up on sudden changes in the data. Additionally, the moving average method requires a sufficient amount of historical data to provide accurate results.
The moving average method is a statistical technique used to analyze time series data. It calculates the average value of a specific variable over a defined period of time, known as the window size. This method is commonly used to identify trends and patterns in data by smoothing out fluctuations and reducing noise.

Is Crypto the Same as Gambling? Both cryptocurrency and gambling involve risk and the potential for financial gain or loss. However, there are …
Read Article
Trading Opportunities in a Rising Interest Rate Environment Interest rate changes can have a significant impact on the financial markets, and being …
Read Article
Is MLM successful in India? Multi-level marketing (MLM) has been gaining increasing popularity in India as a business model, offering individuals the …
Read Article
Employee Stock Option Introduction: Everything You Need to Know Employee stock options are a valuable tool that many companies use to reward and …
Read Article
Guide to Using Google Finance for Currency If you are interested in currency exchange rates, Google Finance is a versatile tool that can provide you …
Read Article
Setting Exponential Moving Average in MT4: Step-by-Step Guide Exponential Moving Average (EMA) is a popular technical analysis tool used by traders to …
Read Article

