


Step-by-step guide: How to delete a demo account on XTB
How to delete a demo account on XTB? If you’re using XTB’s demo account and want to delete it, this step-by-step guide will walk you through the …
Read Article
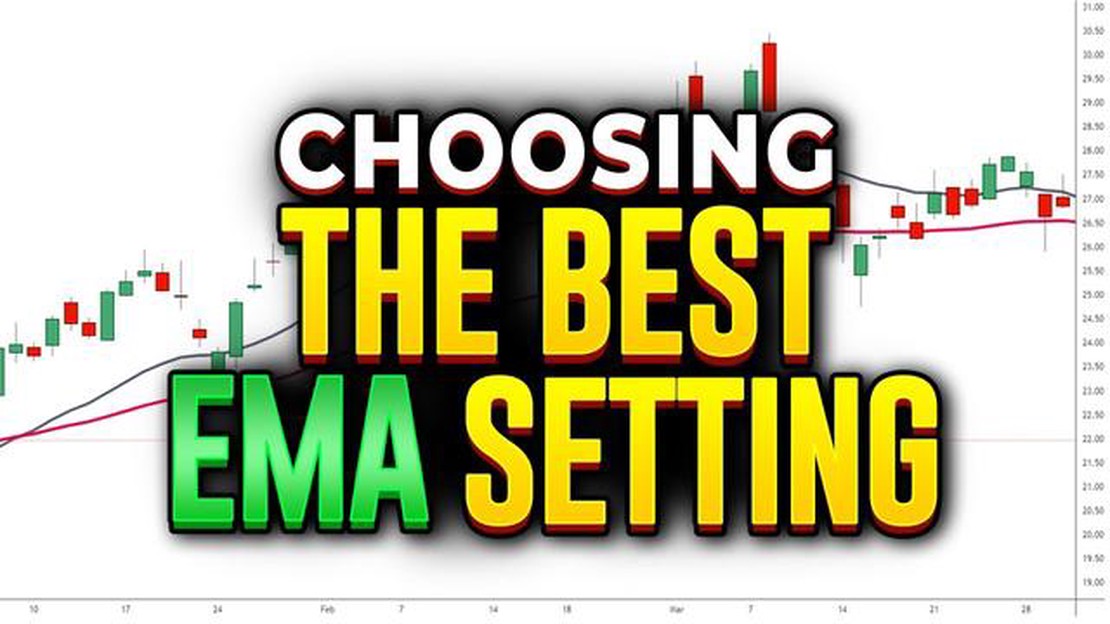
When it comes to technical analysis, the exponential moving average (EMA) is a popular indicator used to identify the trend of a financial instrument. Unlike the simple moving average (SMA), which gives equal weight to all data points, the EMA places more weight on recent data points.
But what are the optimal settings for the EMA? This is a question that many traders and analysts ask themselves. The answer is not so straightforward, as it depends on various factors such as the time frame, volatility of the market, and trading style.
One commonly used setting is the 20-day EMA, which is considered a short-term indicator. Traders who focus on shorter time frames, such as day trading or swing trading, may find this setting useful for capturing short-term trends and reversals.
On the other hand, longer time frames require a different approach. For example, the 50-day or 200-day EMA are often used by long-term investors to identify the overall trend of a stock or index. These longer-term settings are less sensitive to price fluctuations and provide a smoother line that can help filter out noise.

The Exponential Moving Average (EMA) is a popular technical indicator used in financial analysis to analyze trend behavior and determine potential buy and sell signals for trading purposes. It is a type of moving average that gives more weight to recent data points, making it more responsive to price changes and trends.
To calculate the EMA, you start by selecting a period (usually ranging from 5 to 200 days) and a specific smoothing factor. The smoothing factor, also known as the smoothing constant or percentage, determines the rate at which recent data points are weighted. A higher smoothing factor will give more weight to recent data points, while a lower smoothing factor will amplify the effect of past data points.
The formula for calculating the EMA is as follows:
EMA = (Close - EMAprevious day) * smoothing factor + EMAprevious day
Read Also: Is the Dollar to Peso Exchange Rate on the Rise or Decline?
Where:
The initial EMA value is typically calculated using a simple moving average (SMA) for the first period. After that, the formula is applied recursively to calculate the EMA for subsequent periods.
Traders and investors use the EMA to identify potential trend reversals, support and resistance levels, and entry and exit points for their trades. When the price crosses above the EMA, it may indicate a bullish signal, while a cross below the EMA may indicate a bearish signal. The EMA can also be used in conjunction with other indicators and technical analysis tools to further validate trading decisions.
It is important to note that the EMA is a lagging indicator, meaning it does not predict future price movements but rather provides insights into past trends. Therefore, it is crucial to combine the EMA with other indicators and analysis techniques to make informed trading decisions.
In conclusion, the Exponential Moving Average is a powerful tool for analyzing price trends and generating trading signals. Its responsiveness to recent price changes makes it popular among traders looking to identify potential entry and exit points. However, it should be used in conjunction with other indicators and analysis techniques for a comprehensive market analysis.
The performance of the Exponential Moving Average (EMA) is influenced by several factors that traders should consider when setting up their trading strategy:
Read Also: What happens to stock options if fired? Understanding the impact of termination on employee stock options
Understanding these factors and carefully selecting the EMA parameters can help traders optimize their trading strategy and increase the effectiveness of the Exponential Moving Average.
An exponential moving average is a type of moving average that gives more weight to recent prices, and less weight to older prices, in order to reflect the most current market conditions.
The calculation of an exponential moving average involves applying a smoothing constant to the previous day’s moving average and the current day’s closing price.
The main difference between a simple moving average (SMA) and an exponential moving average (EMA) is that the EMA gives more weight to recent prices, while the SMA treats all prices equally.

An exponential moving average can help traders identify the direction of a trend and potential support and resistance levels. It can also be used to generate buy or sell signals when the price crosses over or below the EMA.
There is no one-size-fits-all answer to this question as the optimal period for the EMA can vary depending on the timeframe and the asset being analyzed. It’s recommended to test different periods and find the one that works best for your trading strategy.
An exponential moving average is a type of moving average that places greater weight on more recent data points. It is a technical analysis tool used to identify trends in stock prices and to generate trading signals.

How to delete a demo account on XTB? If you’re using XTB’s demo account and want to delete it, this step-by-step guide will walk you through the …
Read Article
Impact of Dilution on Stock Options Stock options are a popular form of compensation offered to employees and executives, allowing them to purchase …
Read Article
Reporting a Cashless Exercise: Tips and Guidelines A cashless exercise is a common method used by employees to exercise their stock options without …
Read Article
Which bank offers the highest fixed deposit interest rate in Malaysia? When it comes to investing your hard-earned money, finding a reliable and …
Read Article
Understanding the High Costs of PSA Grading PSA grading, also known as Professional Sports Authenticator grading, has become a highly sought-after …
Read Article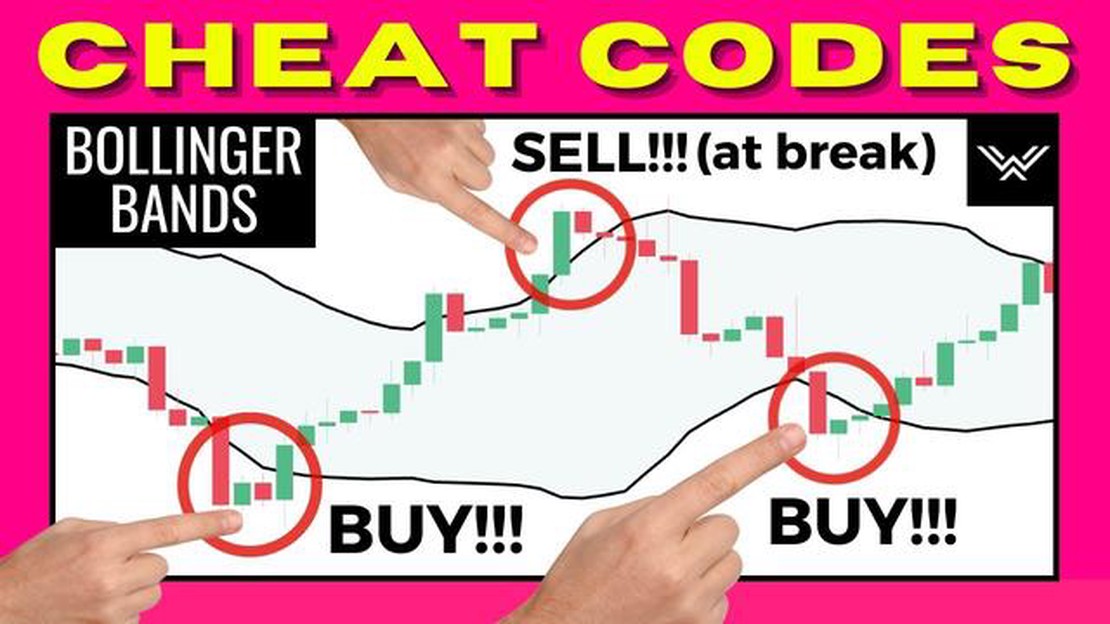
The Best Use of Bollinger Bands: A Comprehensive Guide Bollinger Bands are a popular technical analysis tool used by traders to identify potential buy …
Read Article


