

Exploring the Optimal EMA Settings for Forex Trading
EMA Settings for Forex Trading When it comes to forex trading, one of the most popular technical indicators used by traders is the Exponential Moving …
Read Article
If you are a trader looking to improve your investment strategy, you might want to consider the 5 20 EMA (Exponential Moving Average) crossover strategy. This popular strategy involves using two EMAs, one with a period of 5 and the other with a period of 20, to identify potential buying and selling opportunities in the market.
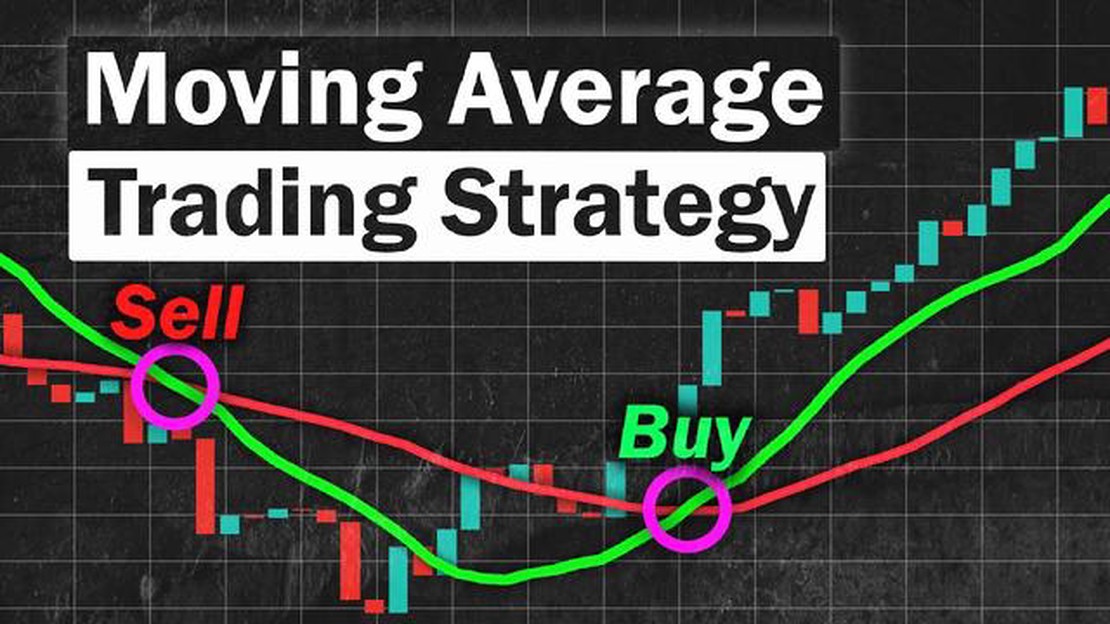
The concept behind the 5 20 EMA crossover strategy is fairly simple. When the shorter-term EMA (5) crosses above the longer-term EMA (20), it is considered a bullish signal, indicating that the price is likely to go up. On the other hand, when the shorter-term EMA crosses below the longer-term EMA, it is seen as a bearish signal, suggesting that the price is likely to go down.
Implementing the 5 20 EMA crossover strategy involves carefully analyzing the EMA lines on a price chart and making trading decisions based on their crossover points. Traders can use these crossover points as entry and exit signals for their trades. For example, when the bullish crossover occurs, traders may consider entering a long position, anticipating a potential uptrend. Conversely, when the bearish crossover occurs, traders may contemplate entering a short position, expecting a potential downtrend.
However, it is important to note that the 5 20 EMA crossover strategy is not foolproof and can result in false signals. Therefore, it is crucial to combine this strategy with additional technical indicators, such as support and resistance levels, volume analysis, and other trend-confirming indicators, to increase the accuracy of your trading decisions.
Remember, successful implementation of the 5 20 EMA crossover strategy requires patience, discipline, and proper risk management. Don’t forget to test this strategy thoroughly on historical data and adjust it to fit your trading style and preferences. With practice and experience, you can harness the power of the 5 20 EMA crossover strategy to potentially improve your trading results.
The 5 20 EMA (Exponential Moving Average) Crossover Strategy is a popular technical analysis technique used by traders to identify potential trend reversals and generate buy or sell signals in the financial markets. This strategy is based on the concept of the crossover between two EMAs, specifically the 5-day EMA and the 20-day EMA.

The EMA is a type of moving average that gives more weight to recent price data, making it more responsive to changes in market trends compared to other types of moving averages. By using EMAs with different time periods, such as the 5-day and 20-day EMAs, traders can capture shorter-term and longer-term trends simultaneously.
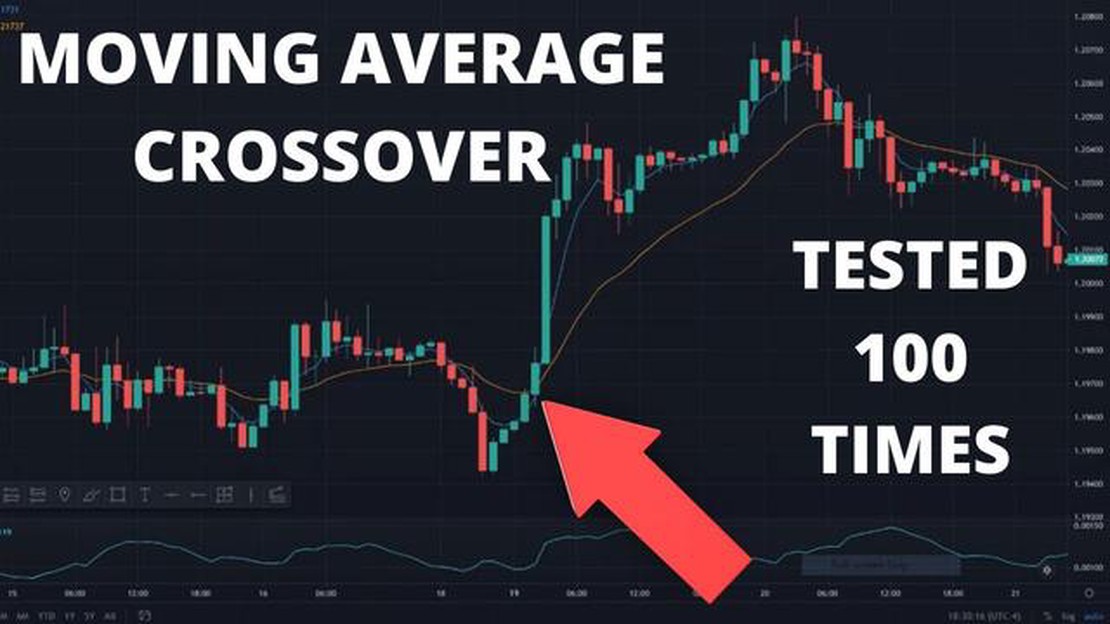
The 5 20 EMA Crossover Strategy works by looking for instances where the shorter-term 5-day EMA crosses above or below the longer-term 20-day EMA. When the 5-day EMA crosses above the 20-day EMA, it generates a bullish signal, indicating a potential uptrend. Conversely, when the 5-day EMA crosses below the 20-day EMA, it generates a bearish signal, indicating a potential downtrend.
Traders often use additional confirmation techniques to filter out false signals and improve the accuracy of the strategy. For example, they may look for the cross to occur above or below certain price levels, or use other technical indicators such as RSI (Relative Strength Index) or MACD (Moving Average Convergence Divergence).
Once a crossover signal is generated, traders can take action by entering a trade in the direction of the signal. They may choose to buy if a bullish signal is generated or sell if a bearish signal is generated. Traders often set stop-loss orders to limit potential losses and take-profit orders to secure profits at predetermined levels.
It is important to note that no trading strategy is foolproof, and the 5 20 EMA Crossover Strategy is no exception. Traders should practice proper risk management and adapt the strategy to their own trading style and risk tolerance. It is also recommended to backtest the strategy on historical data and use it in conjunction with other analysis techniques for better results.
Read Also: What is the Kula exchange an example of? Discover the ancient practice of the Kula exchange
In conclusion, the 5 20 EMA Crossover Strategy is a simple yet effective trading strategy that can be used to identify potential trend reversals and generate buy or sell signals. By focusing on the crossover between the 5-day and 20-day EMAs, traders can take advantage of both shorter-term and longer-term trends in the financial markets.
An exponential moving average is a type of moving average that gives more weight to recent data, making it more responsive to changes in price. The 5-day EMA and the 20-day EMA are commonly used due to their ability to capture short-term and medium-term trends.
The basic idea behind the 5 20 EMA crossover strategy is to identify potential trend reversals or continuation based on the crossover of these two moving averages. When the 5-day EMA crosses above the 20-day EMA, it generates a bullish signal, indicating that the price may continue to rise. Conversely, when the 5-day EMA crosses below the 20-day EMA, it generates a bearish signal, indicating that the price may continue to fall.
Traders typically use this strategy in combination with other indicators and tools to confirm signals and make informed trading decisions. For example, they may consider the volume of trading during the crossover, the presence of support or resistance levels, or other technical patterns to increase the probability of successful trades.
Read Also: A comprehensive guide on using EMA and ADX in trading
It is important to note that the 5 20 EMA crossover strategy is not foolproof and can produce false signals, especially in choppy or sideways markets. Therefore, traders should always exercise proper risk management techniques, such as setting stop-loss orders and taking profits at predetermined levels, to mitigate potential losses.
In conclusion, the 5 20 EMA crossover strategy is a simple yet powerful tool for traders to identify potential entry and exit points in the financial markets. By understanding the basics of this strategy and combining it with other technical analysis tools, traders can increase their chances of making profitable trades.
The 5 20 EMA crossover strategy is a popular technical analysis strategy used in trading. It involves using two exponential moving averages, one with a 5-period and the other with a 20-period. When the shorter-term moving average (5 EMA) crosses above the longer-term moving average (20 EMA), it is considered a bullish signal, indicating a potential buying opportunity. Conversely, when the 5 EMA crosses below the 20 EMA, it is seen as a bearish signal, signaling a potential selling opportunity.
To implement the 5 20 EMA crossover strategy, you need to have a charting platform or trading software that allows you to plot exponential moving averages. Simply plot the 5 EMA and 20 EMA on your chart. When the 5 EMA crosses above the 20 EMA, it is a signal to buy. When the 5 EMA crosses below the 20 EMA, it is a signal to sell. It is important to use other indicators and analysis techniques to confirm the signals and manage your risk effectively.
The 5 20 EMA crossover strategy offers several advantages. Firstly, it is a simple and straightforward strategy that is easy to understand and implement. Secondly, it can be used in various markets and timeframes, making it versatile. Additionally, the strategy can help traders identify potential trend reversals and entry/exit points. However, it is important to note that no strategy is foolproof and proper risk management is essential.

The 5 20 EMA crossover strategy can be used by different types of traders, including day traders, swing traders, and trend followers. Day traders may use shorter timeframes like 5-minute or 15-minute charts, while swing traders may use hourly or daily charts. The strategy can be adapted to fit different trading styles and preferences. However, it is important for traders to backtest and practice the strategy to determine its effectiveness and suitability for their individual trading goals.
Like any trading strategy, the 5 20 EMA crossover strategy has its limitations and risks. It is important to remember that past performance is not indicative of future results, and the strategy may not always generate accurate signals. False signals and whipsaws can occur, resulting in losses. Additionally, relying solely on moving average crossovers may result in missed opportunities and late entries/exits. It is important to use proper risk management, combine it with other analysis techniques, and adapt the strategy to fit current market conditions.
The 5 20 EMA crossover strategy is a trading strategy that involves using two exponential moving averages (EMAs): one with a shorter time period of 5 and one with a longer time period of 20. When the shorter EMA crosses above the longer EMA, it is considered a bullish signal, indicating a potential buying opportunity. On the other hand, when the shorter EMA crosses below the longer EMA, it is considered a bearish signal, indicating a potential selling opportunity.
To implement the 5 20 EMA crossover strategy, you will need to use a charting platform that allows you to plot exponential moving averages. First, add both the 5 EMA and the 20 EMA to your chart. Then, look for instances where the 5 EMA crosses above or below the 20 EMA. When the 5 EMA crosses above the 20 EMA, it is a bullish signal and you may consider buying. Conversely, when the 5 EMA crosses below the 20 EMA, it is a bearish signal and you may consider selling. Remember to also consider other factors such as market trends and support/resistance levels before making a trading decision.

EMA Settings for Forex Trading When it comes to forex trading, one of the most popular technical indicators used by traders is the Exponential Moving …
Read Article
What is the most accurate Supertrend? Supertrend is a popular trading strategy used by traders and investors to predict the direction of price …
Read Article
6 currencies in the dollar index The Dollar Index is a widely followed financial indicator that measures the value of the United States dollar …
Read Article
Is Morgan Stanley the Owner of Etrade? There have been speculations and rumors circulating about whether Morgan Stanley, one of the world’s leading …
Read Article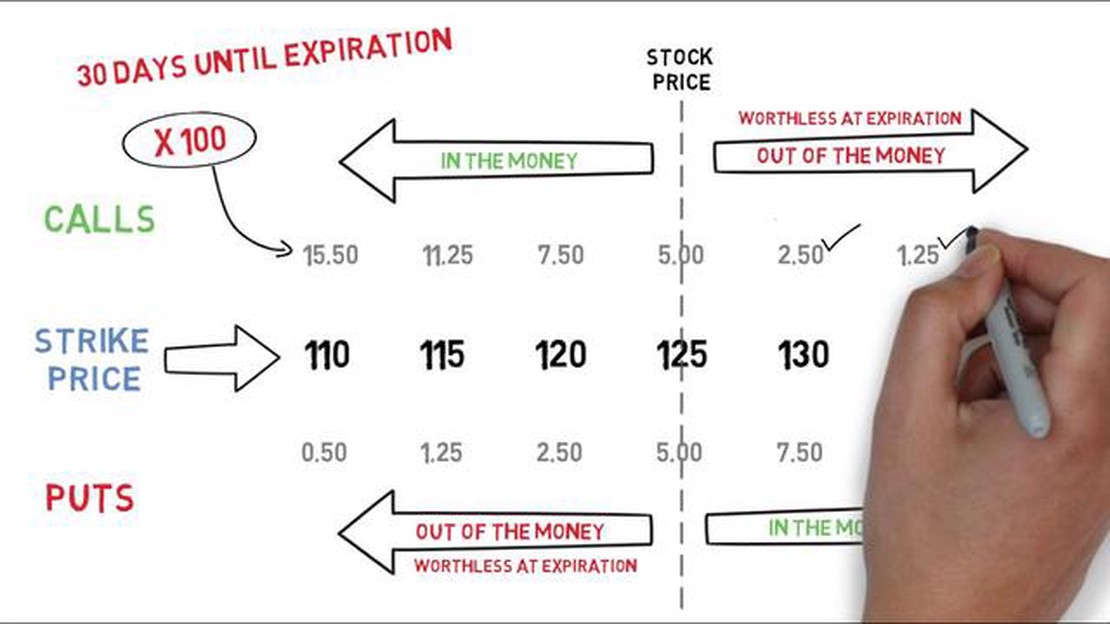
Formula for Call Options Investing in options can be a complex and intimidating process, especially for beginners. One of the key components of …
Read Article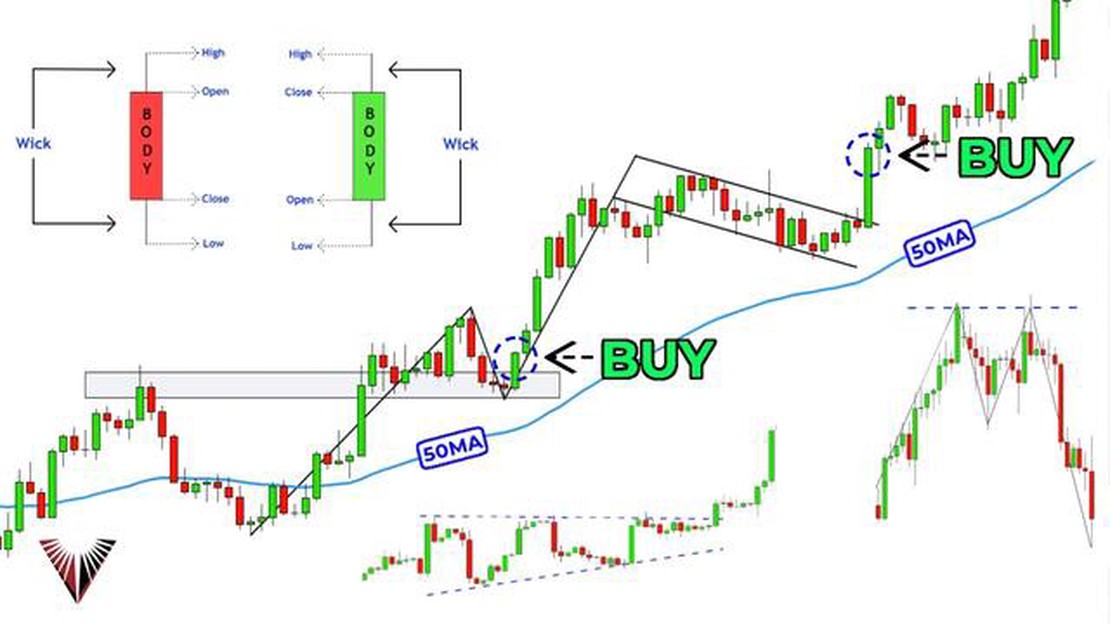
Understanding VT Trading: A Comprehensive Guide VT trading, also known as Virtual Trading, is a method of trading financial instruments using virtual …
Read Article


