


Learn How to Write a Comprehensive Risk Disclaimer | Your Ultimate Guide
Steps to Write an Effective Risk Disclaimer Welcome to our ultimate guide on how to write a comprehensive risk disclaimer. If you have ever visited a …
Read Article
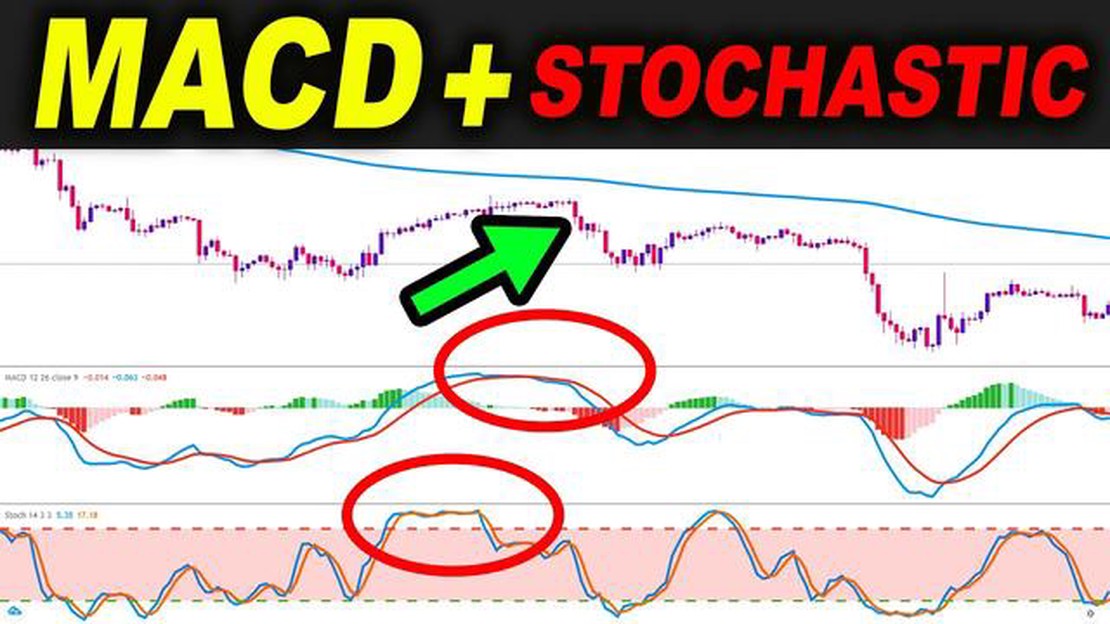
Technical analysis plays a crucial role in the world of trading, helping traders make informed decisions about buying and selling assets. Among the many indicators available, two popular ones are Stochastic and Moving Average Convergence Divergence (MACD). Both indicators aim to identify potential trend reversals and generate buy or sell signals, but they do so using different calculations and interpretations.
The Stochastic indicator, developed by George Lane, measures the momentum of price movements. It compares the closing price of an asset to its price range over a specific period, typically 14 periods. The indicator consists of two lines, %K and %D, which oscillate between 0 and 100. A reading above 80 indicates overbought conditions, while a reading below 20 suggests oversold conditions. Traders often use Stochastic to identify potential turning points in the market.
On the other hand, MACD, developed by Gerald Appel, focuses on the relationship between two moving averages. It consists of a MACD line and a signal line, which are derived by subtracting a longer-term exponential moving average (EMA) from a shorter-term EMA. Positive values between the MACD and signal line indicate bullish momentum, while negative values suggest bearish momentum. Traders utilize MACD to identify the strength and direction of a trend.
Both Stochastic and MACD have their strengths and weaknesses. Stochastic is highly sensitive to price movements and can generate more frequent signals, but it is prone to false signals in sideways markets. Meanwhile, MACD provides a smoother interpretation of price movements and is better suited for trending markets, but it may produce lagging signals.
In conclusion, the choice between Stochastic and MACD ultimately depends on the trader’s preferences and trading style. Traders may choose to use both indicators together, as they can complement each other and provide a more comprehensive analysis. Regardless of the chosen indicator, it is essential for traders to understand their characteristics and limitations to make informed trading decisions.
The Stochastic Indicator is a popular technical analysis tool used by traders to identify potential trend reversals and overbought or oversold conditions in the market. It was developed by George Lane in the 1950s and is based on the premise that as prices rise, closing prices tend to approach the upper end of the price range, and as prices fall, closing prices tend to approach the lower end of the price range.
The Stochastic Indicator consists of two lines: %K and %D. The %K line represents the current closing price relative to the range of prices over a certain period, typically 14 periods, which can be adjusted by the user. The %D line is a moving average of the %K line and is used to smooth out the fluctuations in the indicator.

The Stochastic Indicator oscillates between 0 and 100, with values above 80 indicating overbought conditions and values below 20 indicating oversold conditions. Traders use these overbought and oversold levels to generate buy and sell signals. When the %K line crosses above the %D line and both are below 20, it is considered a buy signal. Conversely, when the %K line crosses below the %D line and both are above 80, it is considered a sell signal.
Traders also pay attention to bullish and bearish divergences between the Stochastic Indicator and the price chart. A bullish divergence occurs when the price forms a lower low, but the Stochastic Indicator forms a higher low, indicating a potential trend reversal to the upside. On the other hand, a bearish divergence occurs when the price forms a higher high, but the Stochastic Indicator forms a lower high, indicating a potential trend reversal to the downside.
It is important to note that the Stochastic Indicator, like any technical analysis tool, is not foolproof and should be used in conjunction with other indicators and analysis techniques. Traders should also consider the overall market conditions and fundamental factors when making trading decisions.
Read Also: Understanding the Minimum Heartbeat in RRDtool: A Comprehensive Guide
The MACD (Moving Average Convergence Divergence) is a widely used technical indicator in financial markets. It is a trend-following momentum indicator that shows the relationship between two moving averages of a security’s price.
The MACD is calculated by subtracting the 26-day exponential moving average (EMA) from the 12-day EMA. A 9-day EMA of the MACD line is then plotted as a signal line. The MACD line oscillates above and below the zero line, while the signal line provides further confirmation of the trend.
The MACD indicator is used to identify potential buying and selling signals in a security. When the MACD line crosses above the signal line, it is considered a bullish signal and indicates a potential buying opportunity. On the other hand, when the MACD line crosses below the signal line, it is considered a bearish signal and indicates a potential selling opportunity.
In addition to providing buy and sell signals, the MACD indicator is also used to identify divergences. Bullish divergences occur when the MACD line makes higher lows while the price makes lower lows, indicating a potential reversal to the upside. Conversely, bearish divergences occur when the MACD line makes lower highs while the price makes higher highs, indicating a potential reversal to the downside.
Traders and investors commonly use the MACD indicator to confirm the strength of a trend, identify potential trend reversals, and generate trading signals. It can be used in conjunction with other technical indicators and chart patterns to enhance its effectiveness.
The Stochastic and Moving Average Convergence Divergence (MACD) indicators are two popular technical analysis tools used by traders to identify potential trading opportunities in financial markets. While both indicators are widely used, they have different characteristics and can be used in different ways.
The Stochastic indicator is a momentum indicator that compares the closing price of an asset to its price range over a certain period of time. It consists of two lines, %K and %D, that fluctuate between 0 and 100. The %K line represents the current closing price in relation to the price range, while the %D line is a moving average of the %K line. Traders use the Stochastic indicator to identify overbought and oversold conditions in the market, which could indicate a potential reversal in the price trend.
On the other hand, the MACD indicator is a trend-following momentum indicator that compares two moving averages of an asset’s price. It consists of a MACD line, a signal line, and a histogram. The MACD line is the difference between the 26-day and 12-day exponential moving averages, while the signal line is a 9-day exponential moving average of the MACD line. Traders use the MACD indicator to identify potential trend reversals and confirm the strength of a trend.
Read Also: Is TD Ameritrade the same as Scottrade? Unveiling the Key Differences
When comparing the Stochastic and MACD indicators, it is important to consider their strengths and weaknesses. The Stochastic indicator is best suited for identifying overbought and oversold conditions in a sideways market, where price tends to fluctuate within a range. Traders can use the Stochastic indicator to enter trades when the %K line crosses above or below the %D line, indicating a potential reversal in the price trend.
On the other hand, the MACD indicator is best suited for identifying the direction and strength of a trend in a trending market. Traders can use the MACD indicator to enter trades when the MACD line crosses above or below the signal line, indicating a potential trend reversal. Additionally, the MACD histogram can be used to confirm the strength of a trend, with higher histogram bars indicating a stronger trend.
| Indicator | Strengths | Weaknesses |
|---|---|---|
| Stochastic | Effective in sideways markets | Less effective in trending markets |
| MACD | Effective in trending markets | Less effective in sideways markets |

In conclusion, both the Stochastic and MACD indicators can be useful tools for traders, but their effectiveness depends on the market conditions. The Stochastic indicator is better suited for sideways markets, while the MACD indicator is better suited for trending markets. Traders should understand the characteristics of each indicator and use them accordingly to make informed trading decisions.
The Stochastic indicator measures the momentum of price movements and identifies overbought and oversold conditions, while the MACD (Moving Average Convergence Divergence) indicator measures the relationship between two moving averages to identify bullish or bearish market trends.
Both the Stochastic and MACD indicators can be effective for determining entry and exit points in trading, but it ultimately depends on the specific trading strategy and market conditions. Some traders may prefer the Stochastic indicator for its ability to identify overbought and oversold conditions, while others may prefer the MACD indicator for its ability to identify market trends.
Yes, the Stochastic and MACD indicators can be used together to provide confirmation signals. Traders can look for instances where both indicators provide a buy or sell signal, which can increase the overall reliability of the trading signal.
Some drawbacks or limitations of using the Stochastic or MACD indicators include the potential for false signals, especially in choppy or sideways markets. Additionally, these indicators are lagging indicators, meaning they may not provide timely signals in fast-moving markets. Traders should also be aware of the specific parameters and settings used for these indicators, as different settings may yield different results.

Steps to Write an Effective Risk Disclaimer Welcome to our ultimate guide on how to write a comprehensive risk disclaimer. If you have ever visited a …
Read Article
Is Trading Forex a Profitable Side Hustle? Forex trading, also known as foreign exchange trading, has gained immense popularity as a potential side …
Read Article
Understanding Illiquid Currency Pairs: An In-depth Analysis When it comes to trading in the foreign exchange market, it is important to understand the …
Read Article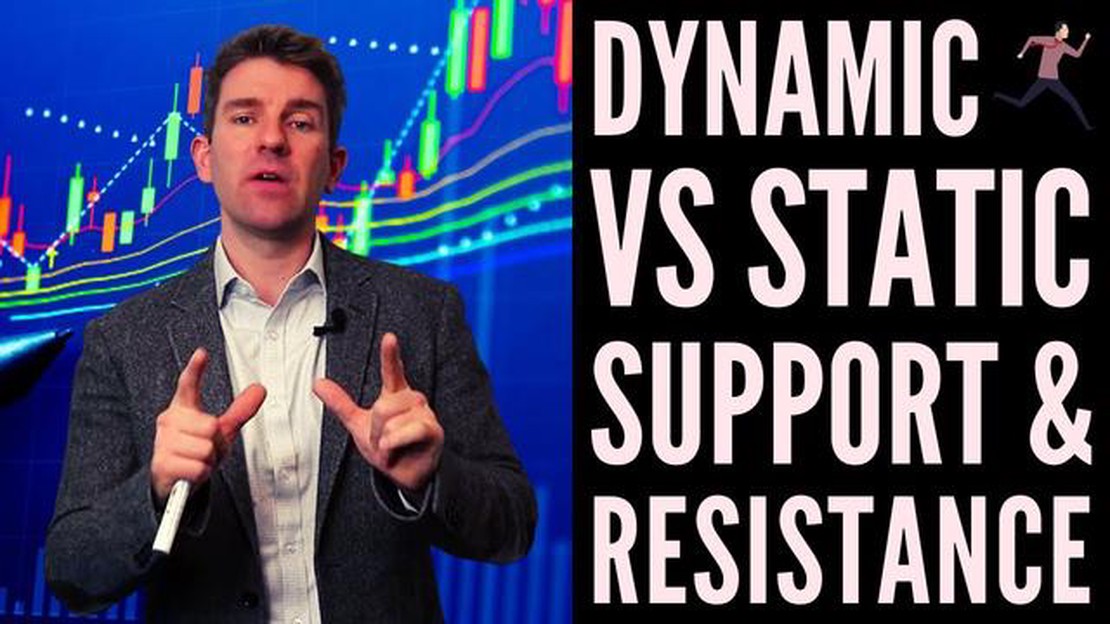
Understanding Dynamic Support and Resistance in Forex Trading In the world of forex trading, support and resistance levels play a crucial role in …
Read Article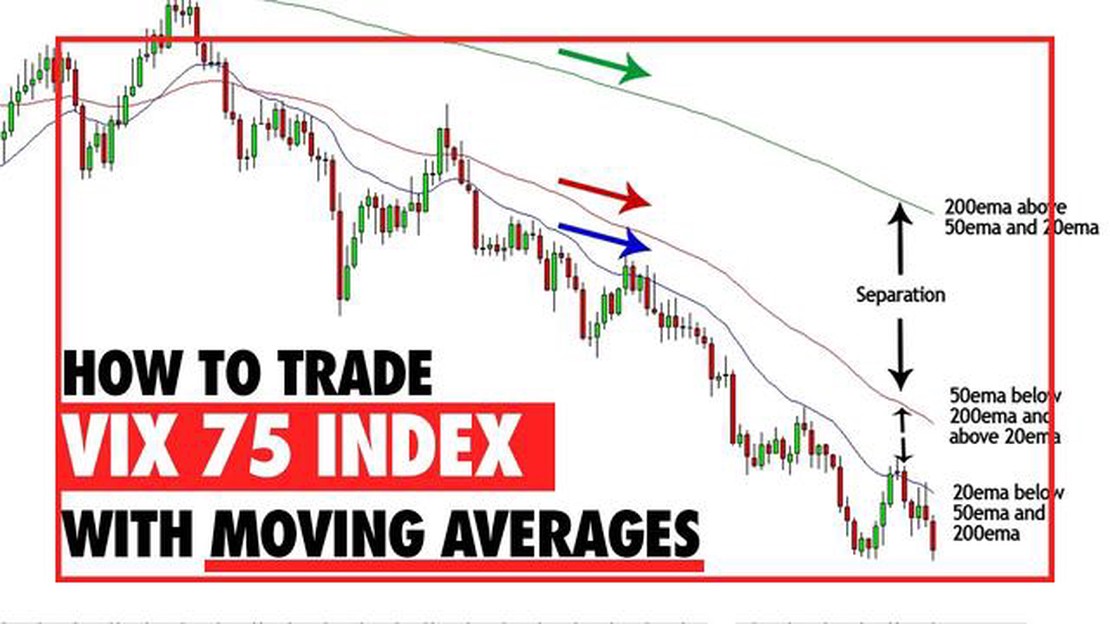
What is the 50-day moving average of the VIX? The VIX, also known as the Volatility Index, is a widely watched measure of market volatility. Traders …
Read Article
Is the Forex Market Open Tonight? Forex, also known as the foreign exchange market, is the largest and most liquid financial market in the world. With …
Read Article


