


Steps to Recover Lost Funds from Binary Options Trading
How to recover lost funds from binary options? Binary options trading can be a highly risky endeavor, and many people have found themselves in a …
Read Article
When it comes to investing in the stock market, having a solid strategy is crucial. One popular strategy that many traders use is the Exponential Moving Average (EMA) cross. This strategy involves the use of two different EMAs, typically a shorter-term EMA and a longer-term EMA, to identify entry and exit points for trades.
The EMA is a type of moving average that places more emphasis on recent price data. This makes it more responsive to changes in price compared to a simple moving average. By using two different EMAs, traders can look for instances where the shorter-term EMA crosses above or below the longer-term EMA as a signal to buy or sell.
However, not all EMA crosses are created equal. The effectiveness of the strategy can vary depending on the time frame and the specific EMAs used. Some traders prefer to use shorter-term EMAs for more frequent trades, while others opt for longer-term EMAs for a more trend-following approach.
In this article, we will explore the different factors to consider when comparing EMA crosses and finding the best strategy for your investments. We will discuss the importance of choosing the right time frame, selecting the most appropriate EMAs, and analyzing the overall market conditions. By understanding these key elements, you can make more informed decisions and potentially improve your trading results.
EMA (Exponential Moving Average) crosses are a popular tool used by investors to identify potential buy or sell signals in the stock market. By understanding how EMA crosses work and how to interpret them, investors can improve their investment strategy and make more informed trading decisions.
The EMA is a type of moving average that places more weight on recent price data, making it more responsive to changes in stock prices compared to the simple moving average. The EMA cross occurs when two EMAs with different time periods intersect, indicating a change in the stock’s trend.
There are two types of EMA crosses: bullish and bearish. A bullish EMA cross happens when a shorter-term EMA, such as the 50-day EMA, crosses above a longer-term EMA, such as the 200-day EMA. This can be seen as a buy signal, suggesting that the stock’s price is likely to continue its upward trend.
On the other hand, a bearish EMA cross occurs when the shorter-term EMA crosses below the longer-term EMA. This is a sell signal, indicating that the stock’s price may decline in the near future.
It’s important to note that EMA crosses are not foolproof indicators and should be used in conjunction with other technical analysis tools and fundamental analysis. However, they can provide valuable insights into market trends and help investors make more informed investment decisions.
When interpreting EMA crosses, it’s crucial to consider the overall market conditions and the stock’s fundamentals. For example, a bullish EMA cross may not be significant in a bearish market or if the stock’s fundamentals are weak. Conversely, a bearish EMA cross may be less meaningful in a bullish market or if the stock’s fundamentals are strong.
To further improve your investment strategy using EMA crosses, it’s essential to backtest different combinations of EMAs and time periods to find the optimal configuration for your trading style. This can be done using trading software or online platforms that provide historical stock data and technical analysis tools.

In conclusion, understanding EMA crosses is a valuable skill for investors looking to improve their investment strategy. By learning how to interpret EMA crosses and incorporating them into your overall analysis, you can gain a better understanding of market trends and make more informed trading decisions.
EMA crosses, or Exponential Moving Average crosses, are a popular technical analysis tool used by investors to identify potential buy or sell signals in the financial markets. The Exponential Moving Average is a type of moving average that assigns more weight to recent price data, making it more responsive to changes in the market compared to a simple moving average.
Read Also: Learn How to Use the MACD 2 Line Indicator for MT4
EMA crosses occur when the shorter-term EMA line crosses above or below the longer-term EMA line on a price chart. This crossover is seen as a signal that the trend of the market may be changing, and investors can use it to inform their investment decisions.
EMA crosses matter in investing because they can provide valuable insights into market trends and help investors make better trading decisions. By identifying the points at which the shorter-term EMA line crosses the longer-term EMA line, investors can determine whether the market is in an uptrend or a downtrend.
EMA crosses can also be used to generate buy or sell signals. For example, when the shorter-term EMA line crosses above the longer-term EMA line, it is considered a bullish signal, indicating that it may be a good time to buy the asset. Conversely, when the shorter-term EMA line crosses below the longer-term EMA line, it is considered a bearish signal, suggesting that it may be a good time to sell the asset.
However, it is important to note that EMA crosses are not foolproof and should be used in conjunction with other technical analysis tools and fundamental analysis to make well-informed investment decisions. They are just one tool in the investor’s toolbox and should not be relied upon solely to drive investment strategies.
In conclusion, EMA crosses are a valuable tool for investors to analyze market trends and generate buy or sell signals. They can help investors make better-informed investment decisions and improve the profitability of their portfolios.
When comparing Exponential Moving Average (EMA) crosses, there are several key factors that investors should consider. These factors can greatly affect the effectiveness of a trading strategy utilizing EMA crosses.
Read Also: Is Covered Call a Bullish Strategy? Exploring the Pros and Cons3. Cross Confirmation: It is important to consider cross confirmation when comparing EMA crosses. This involves using additional technical indicators or methods to confirm the EMA cross signal. For example, a trader may use a trend line break or a momentum oscillator to validate the EMA cross signal before entering a trade. 4. Market Conditions: The market conditions at the time of the EMA cross should also be taken into account. A strong trending market may produce more reliable signals, while a sideways or choppy market may generate false signals. It is important to assess the overall market conditions before acting on an EMA cross signal.
 5. Risk Management: Proper risk management is vital when utilizing EMA crosses. This includes setting appropriate stop-loss orders to limit potential losses and determining the appropriate position size based on the investor’s risk tolerance. Risk management strategies should always be considered when comparing EMA crosses.
By considering these key factors, investors can make more informed decisions when comparing EMA crosses and develop a trading strategy that aligns with their investment goals and risk appetite. It is important to remember that no trading strategy is foolproof, and careful analysis and evaluation are necessary to achieve success in the market.
EMA stands for Exponential Moving Average. It is a popular technical indicator used in financial analysis to identify trends and potential buy or sell signals in the market.
EMA differs from other moving averages in that it places greater weight on more recent data points, making it more responsive to price changes. This means that the EMA can provide faster and more timely signals compared to other moving averages.
EMA crosses occur when a shorter-term EMA line crosses above or below a longer-term EMA line on a price chart. These crosses are used by traders to identify potential buy or sell signals.
EMA crosses can be used to develop a trading strategy by generating buy or sell signals. When the shorter-term EMA crosses above the longer-term EMA, it may signal a buy opportunity, while a cross below can indicate a sell opportunity. Traders can also use additional indicators and filters to confirm EMA crosses and improve the accuracy of their trading strategy.
When comparing EMA crosses, it is important to consider the timeframes of the EMAs, the number of periods used to calculate the EMAs, and the market conditions in which the strategy was tested. Traders should also assess the overall profitability, risk, and consistency of the strategy before implementing it in their own investment decisions.
EMA cross strategy is a popular trading strategy that uses exponential moving average (EMA) indicators to generate trading signals. It involves the intersection of two EMAs of different periods, typically a shorter-term EMA and a longer-term EMA. When the shorter-term EMA crosses above the longer-term EMA, it is considered a bullish signal, indicating a potential buying opportunity. Conversely, when the shorter-term EMA crosses below the longer-term EMA, it is considered a bearish signal, indicating a potential selling opportunity.
Determining the best EMA periods for your investments depends on various factors, including your trading style, time frame, and the specific asset you are trading. Shorter-term EMAs, such as 10-day or 20-day EMAs, are generally more responsive to short-term price movements but can also generate more false signals. Longer-term EMAs, such as 50-day or 200-day EMAs, are more reliable indicators of the overall trend but can be slower to react to short-term changes. Experimenting with different EMA periods and backtesting historical data can help you identify the most effective EMA crosses strategy for your investments.

How to recover lost funds from binary options? Binary options trading can be a highly risky endeavor, and many people have found themselves in a …
Read Article
Understanding Forex Investment: A Guide to the Foreign Exchange Market Have you ever wondered what Forex investment is all about? How can people make …
Read Article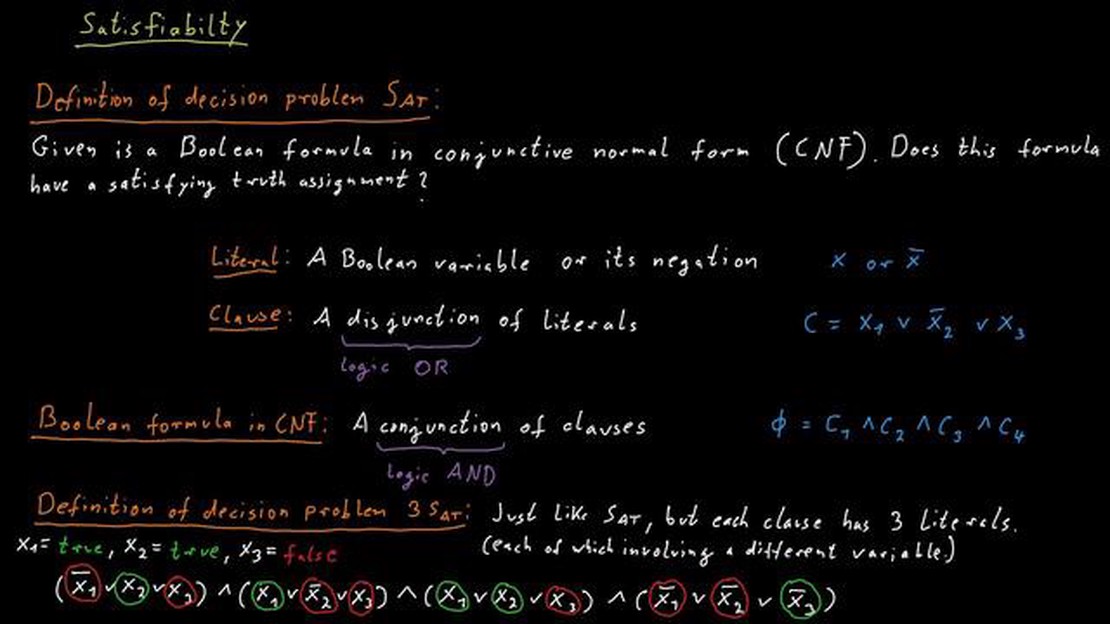
Understanding the 3SAT Problem: Explained in Detail The 3SAT problem is one of the most fundamental and well-studied problems in computer science and …
Read Article
Introduction to Options Trading in Hindi Welcome to our comprehensive guide on options trading in Hindi. Whether you are a beginner or an experienced …
Read Article
Understanding the Regulation of FX Trading In the world of foreign exchange (FX) trading, understanding the regulations that govern this market is …
Read Article
Is there a monthly fee for forex? Trading on the foreign exchange market, also known as forex, can be a lucrative endeavor. However, before you dive …
Read Article


