


What is a Forex expert: Understanding the role and skills of a financial trading pro
What is a Forex expert? Foreign exchange, or Forex, trading is a fast-paced and highly volatile market where individuals can trade currencies from …
Read Article
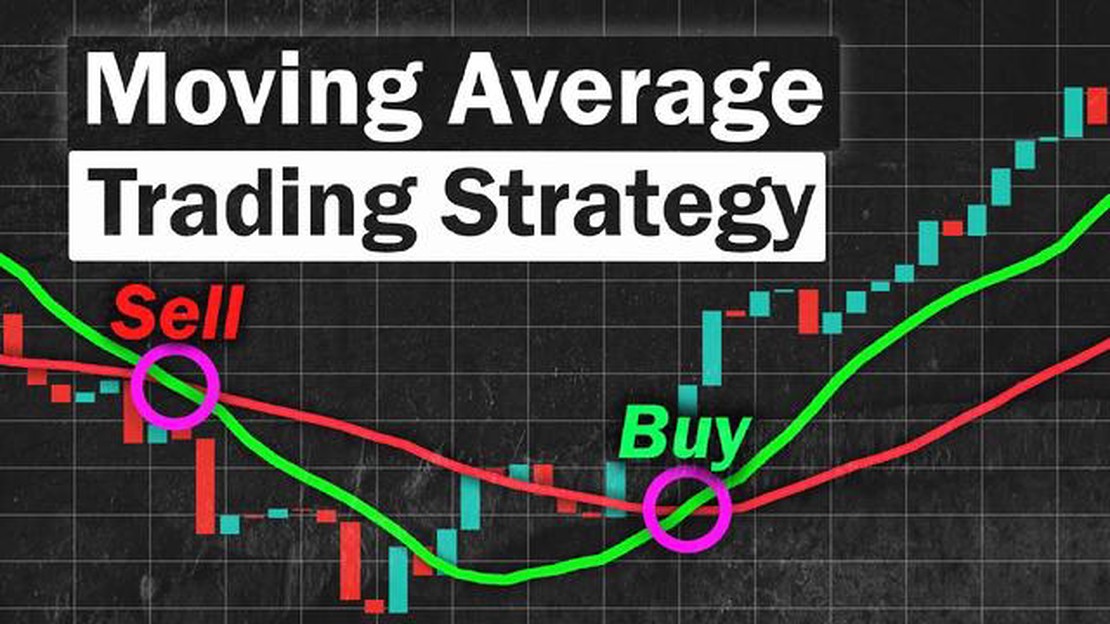
When it comes to trading in the financial markets, finding a reliable strategy can be a daunting task. One popular approach is using moving averages to identify potential buying and selling opportunities. Moving averages, which calculate the average price over a specific period of time, can help traders smooth out price data and identify trends. Among the different types of moving averages, the crossover strategy is widely used and highly regarded for its ability to signal trend changes. In this article, we will compare and analyze different moving average crossover strategies to determine which one is the best.
The moving average crossover strategy involves two moving averages: a short-term moving average and a long-term moving average. When the short-term moving average crosses above the long-term moving average, it is considered a bullish signal, indicating a potential uptrend. Conversely, when the short-term moving average crosses below the long-term moving average, it is considered a bearish signal, indicating a potential downtrend.
There are various combinations of moving averages that traders can use for the crossover strategy, such as the 50-day and 200-day moving averages, the 20-day and 100-day moving averages, or the 10-day and 50-day moving averages. Each combination has its own strengths and weaknesses, and it is important for traders to find the one that suits their trading style and goals the best.
In this article, we will compare the performance of different moving average crossover strategies using historical price data. We will analyze factors such as profitability, drawdown, and risk-reward ratio to determine which strategy is the most effective. By conducting a comprehensive comparison, traders can make informed decisions and increase their chances of success in the financial markets.
There are several popular moving average crossover strategies that traders often use to make trading decisions. These strategies involve using two moving averages and monitoring their intersection points to identify potential buying or selling opportunities. In this section, we will compare some of the most commonly used moving average crossover strategies.
1. Simple Moving Average (SMA) Crossover: This strategy involves using two simple moving averages of different time periods, such as a shorter-term SMA and a longer-term SMA. When the shorter-term SMA crosses above the longer-term SMA, it is considered a bullish signal and traders may consider buying. Conversely, when the shorter-term SMA crosses below the longer-term SMA, it is considered a bearish signal and traders may consider selling.

2. Exponential Moving Average (EMA) Crossover: Similar to the SMA crossover strategy, the EMA crossover strategy also uses two moving averages of different time periods. However, the EMA gives more weight to recent price data, making it more responsive to recent price movements. This strategy may be preferred by traders who want to react quickly to market changes.
3. Moving Average Ribbon: Instead of using just two moving averages, the moving average ribbon strategy involves using multiple moving averages of different time periods. These moving averages are plotted on the same chart, creating a ribbon-like appearance. Traders look for the moving averages to bunch together or diverge as a sign of potential buying or selling opportunities.
4. Moving Average Envelope: This strategy involves plotting two moving averages around a main moving average. The upper band is created by adding a fixed percentage to the main moving average, while the lower band is created by subtracting the same fixed percentage. Traders may consider buying when the price moves above the upper band and selling when the price moves below the lower band.
5. Moving Average Crossover with MACD: The moving average crossover strategy can also be combined with the Moving Average Convergence Divergence (MACD) indicator. In this strategy, traders use the crossover of two moving averages along with the MACD histogram to confirm the trading signals. The MACD histogram provides additional insights into the strength of the crossover signal.
When comparing these popular moving average crossover strategies, it is important to consider factors such as the trader’s preferred time frame, risk tolerance, and market conditions. Different strategies may work better in different market environments, so it is crucial to test and adjust these strategies to fit individual trading styles.
Read Also: Discover the Current Amount Held by the RBA | RBA Holdings Analysis
When it comes to trading strategies, moving averages are a common tool used by many traders. They help smoothen out price data and provide insights into the direction of a trend. However, there are different types of moving averages that traders can use, and it is important to analyze their effectiveness in order to determine which one is best suited for a particular trading strategy.
One commonly used moving average is the simple moving average (SMA). This type of moving average calculates the average price over a specified period of time, giving equal weight to each price point. The SMA is easy to calculate and provides a clear indication of the overall trend.
Read Also: Is an M pattern bullish? Learn about the bullish M pattern in this comprehensive guide
Another type of moving average is the exponential moving average (EMA). This moving average places more weight on recent price data, making it more responsive to changes in price. The EMA is often preferred by short-term traders as it reacts quickly to market movements.
To determine the effectiveness of different moving averages, traders can analyze a variety of factors. One important factor to consider is the lag. Lag refers to the delay between the price action and the moving average line. A shorter lag can provide more timely signals, but it may also result in more false signals. On the other hand, a longer lag can help filter out noise, but it may also result in delayed signals.
Another factor to consider is the accuracy of the moving average in identifying trend reversals. Traders can use moving average crossovers to identify when a short-term moving average crosses above or below a longer-term moving average, signaling a potential trend change. The effectiveness of this signal can vary depending on the type of moving average used.
Additionally, traders can analyze the sensitivity of the moving average to price fluctuations. A more sensitive moving average will react quickly to changes in price, but it may also generate more false signals. A less sensitive moving average may provide more reliable signals, but it may lag behind in capturing trend reversals.
Overall, analyzing the effectiveness of different moving averages is crucial in determining which one is best suited for a trading strategy. Factors such as lag, trend reversal identification, and sensitivity to price fluctuations should be carefully considered. By understanding the strengths and weaknesses of each moving average type, traders can enhance their trading strategies and make more informed decisions.

A moving average crossover strategy is a trading strategy that uses the intersection of two or more moving averages to generate buy or sell signals in the financial markets. It is based on the idea that when a short-term moving average crosses above or below a long-term moving average, it indicates a change in the market trend.
Choosing the best moving average crossover strategy depends on several factors, such as the time frame of the trading strategy, the financial instrument being traded, and the desired level of risk. It is important to backtest different strategies using historical data to determine their performance and make an informed decision.
There are several advantages of using a moving average crossover strategy. First, it is a simple and easy-to-understand strategy that does not require complex mathematical calculations. Second, it helps to filter out noise and identify the overall market trend. Third, it can be used in multiple time frames and for various financial instruments.
Yes, there are some limitations to using a moving average crossover strategy. One limitation is that it may generate false signals during periods of low volatility or choppy markets. Another limitation is that it may lag behind the actual market price, resulting in missed trading opportunities or delayed entry/exit points. Additionally, moving averages are trend-following indicators and may not work well in ranging or sideways markets.

What is a Forex expert? Foreign exchange, or Forex, trading is a fast-paced and highly volatile market where individuals can trade currencies from …
Read Article
Understanding the Difference between Margin and Leverage in Forex Trading Forex trading has become increasingly popular in recent years, attracting …
Read Article
What is the formula for volume weighted average? When it comes to analyzing financial markets, one of the most commonly used indicators is the Volume …
Read Article
Understanding Hang Seng Index Options The Hang Seng Index (HSI) is one of the most widely followed stock market indices in Asia. As a benchmark for …
Read Article
Minimum Salary in Kuwait: What You Need to Know When it comes to understanding the labor market in Kuwait, one important factor to consider is the …
Read Article
Understanding Forex Trading in South Africa Forex trading, also known as foreign exchange trading, has become a popular investment opportunity in …
Read Article


