


Where to Buy USD in Sydney: A Comprehensive Guide
Where to Buy USD in Sydney: A Step-by-Step Guide Are you planning a trip to the United States and need to buy USD? This comprehensive guide will …
Read Article
Introduction
The Volume Adjusted Moving Average (VAMA) is a technical analysis tool that takes into account both price and volume in order to provide a more accurate representation of a security’s trend. Traditional moving averages only consider price, which can lead to false signals in highly volatile markets. By incorporating volume, the VAMA helps to filter out noise and provide a clearer picture of market trends.
Step 1: Calculate the Volume Ratio
In order to calculate the VAMA, the first step is to determine the volume ratio. This ratio is calculated by dividing the volume of a trading period by the average volume over a specified number of periods. A higher volume ratio indicates higher than average volume, while a lower volume ratio indicates lower than average volume.
Step 2: Calculate the VAMA
Once the volume ratio is determined, the next step is to calculate the VAMA. This is done by multiplying the volume ratio by the closing price for each period, and then summing these values over the specified number of periods. This sum is then divided by the sum of the volume ratios to obtain the VAMA.
“The VAMA helps to smooth out price fluctuations and provide a more accurate measure of the security’s price trend. It can be used as a standalone indicator or in conjunction with other technical analysis tools.”
Step 3: Interpret the VAMA
Interpreting the VAMA involves comparing it to the security’s price. A rising VAMA indicates that the security is in an uptrend, while a falling VAMA suggests a downtrend. Additionally, the angle of the VAMA can provide insights into the strength of the trend. Steep angles indicate strong trends, while flat angles suggest a lack of momentum.
Conclusion
The Volume Adjusted Moving Average is a powerful tool for technical analysis that combines price and volume to provide a more accurate representation of a security’s trend. By incorporating volume, the VAMA helps to filter out noise and provide clearer signals in highly volatile markets. Traders and investors can use the VAMA to gain insights into the strength and direction of a security’s trend, helping them make more informed decisions.
The volume adjusted moving average (VAMA) is a technical indicator used to analyze the price movement of a financial asset while taking into account the volume of trades. It helps traders to identify trends and make informed decisions based on the relationship between price and volume.

To calculate the VAMA, you need to follow these steps:
1. Collect Data: Gather the historical price and volume data for the specific period you want to analyze. This data should include the closing prices and corresponding volumes for each time interval (e.g., day, week, month).
2. Calculate the Volume Ratio: For each data point, calculate the volume ratio by dividing the trading volume by a chosen period’s average volume. The average volume can be calculated by summing the volumes for the selected period and dividing it by the number of data points.
3. Calculate the Weighted Price: Multiply each closing price by its corresponding volume ratio. This will give more weight to data points with higher volume and adjust the moving average based on volume fluctuations.
4. Calculate the Volume Adjusted Moving Average: Calculate the moving average by summing the weighted prices for the selected period and dividing it by the number of data points in that period. The moving average can be calculated using various methods, such as simple moving average or exponential moving average.
Read Also: Where to Find Qualified Leads: Top Strategies and Resources
5. Analyze the Results: Plot the volume adjusted moving average on a chart to visually analyze the price trends. Traders often look for crossovers between the VAMA and the asset’s price to identify potential trading signals.
Note: The period you choose for calculating the VAMA will depend on your trading strategy and the time frame you are analyzing. Shorter periods provide more responsive moving averages, while longer periods offer a smoother average.
By calculating the volume adjusted moving average, traders can gain valuable insights into the price and volume dynamics of a financial asset. This can help them make more accurate predictions about future price movements and improve their trading strategies.
The Volume Adjusted Moving Average (VAMA) is a technical indicator used in financial analysis to calculate the average price of an asset based on its trading volume over a specified time period. It is a variation of the traditional moving average, which is calculated by averaging the prices of an asset over a specific time frame.
Read Also: Are Forex Demo Accounts Accurate? Find Out the Truth Here
The VAMA takes into account both the price and volume of an asset, giving more weight to periods of higher trading volume. This provides a more accurate representation of the average price and helps identify trends and patterns in the market.
To calculate the VAMA, you first need to determine the time period over which you want to calculate the moving average. This can be as short as a few days or as long as several months, depending on your trading strategy and objectives.
Next, you need to calculate the average volume for each period within the chosen time frame. This is done by summing up the trading volume for each period and dividing it by the number of periods.
Once you have the average volume for each period, you can calculate the volume adjusted price for each period by multiplying the closing price of the asset by the ratio of the period’s volume to the average volume.
Finally, you can calculate the VAMA by taking the sum of the volume adjusted prices for each period and dividing it by the sum of the volume for those periods.

| Period | Volume | Closing Price | Volume Adjusted Price |
|---|---|---|---|
| 1 | 100,000 | 50.00 | 50.00 |
| 2 | 150,000 | 55.00 | 61.11 |
| 3 | 200,000 | 60.00 | 66.67 |
| 4 | 120,000 | 52.00 | 44.44 |
In the example above, the average volume is calculated as 142,500. The volume adjusted price for each period is calculated by multiplying the closing price by the ratio of the period’s volume to the average volume. The VAMA is then calculated by taking the sum of the volume adjusted prices (222.22) and dividing it by the sum of the volume (570,000), resulting in a VAMA of approximately 0.389.
The VAMA can be used in various ways to analyze the market. It can be plotted on a chart to identify trends and reversals, as well as to generate trading signals. Traders and investors can also use the VAMA to determine support and resistance levels and make more informed trading decisions.
Overall, the volume adjusted moving average is a valuable tool for technical analysis that incorporates both price and volume to provide a more accurate representation of an asset’s average price over time. It can help traders and investors identify trends, make better trading decisions, and improve their overall trading strategies.
Volume Adjusted Moving Average (VAMA) is a technical analysis indicator that uses both price and volume data to calculate a moving average. It gives more weightage to periods with higher trading volume, allowing traders to get a better understanding of the price activity.
VAMA is calculated by multiplying the closing price of each period by its corresponding volume. The sum of these values over a specified number of periods is then divided by the total volume over the same period to obtain the VAMA value.
The benefit of using VAMA is that it provides a more accurate representation of price trends by incorporating the trading volume. By giving more weightage to periods with higher volume, it focuses on periods of increased market activity and filters out noise caused by low volume periods.
Yes, VAMA can be used for different timeframes. Traders can adjust the number of periods used in the calculation to match their preferred timeframe, whether it’s short-term, medium-term, or long-term.
VAMA can be used in trading in various ways. It can be used as a standalone indicator to identify price trends and support/resistance levels. It can also be combined with other technical indicators to generate trading signals. For example, a bullish crossover of the VAMA with a shorter-term moving average may be used as a buy signal.
The Volume Adjusted Moving Average (VAMA) is a technical analysis indicator that calculates the average price of a security over a specific time period, taking into account the trading volume during that period.

Where to Buy USD in Sydney: A Step-by-Step Guide Are you planning a trip to the United States and need to buy USD? This comprehensive guide will …
Read Article
Discover Effective Forex Trading Strategies Forex trading is a dynamic and fast-paced market where traders buy and sell currency pairs with the aim of …
Read Article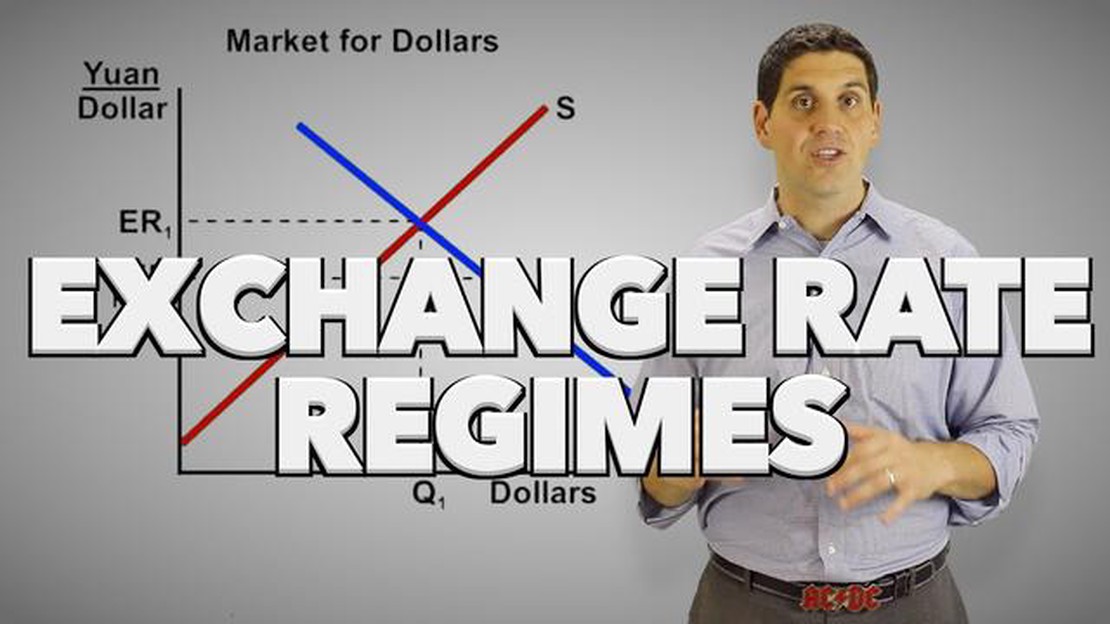
Does Hong Kong Have a Floating Exchange Rate? Hong Kong is known for its unique currency system, which is often referred to as a “linked exchange rate …
Read Article
Does out of stock mean it will come back? Have you ever visited an online store and found that the item you wanted to purchase was out of stock? It …
Read Article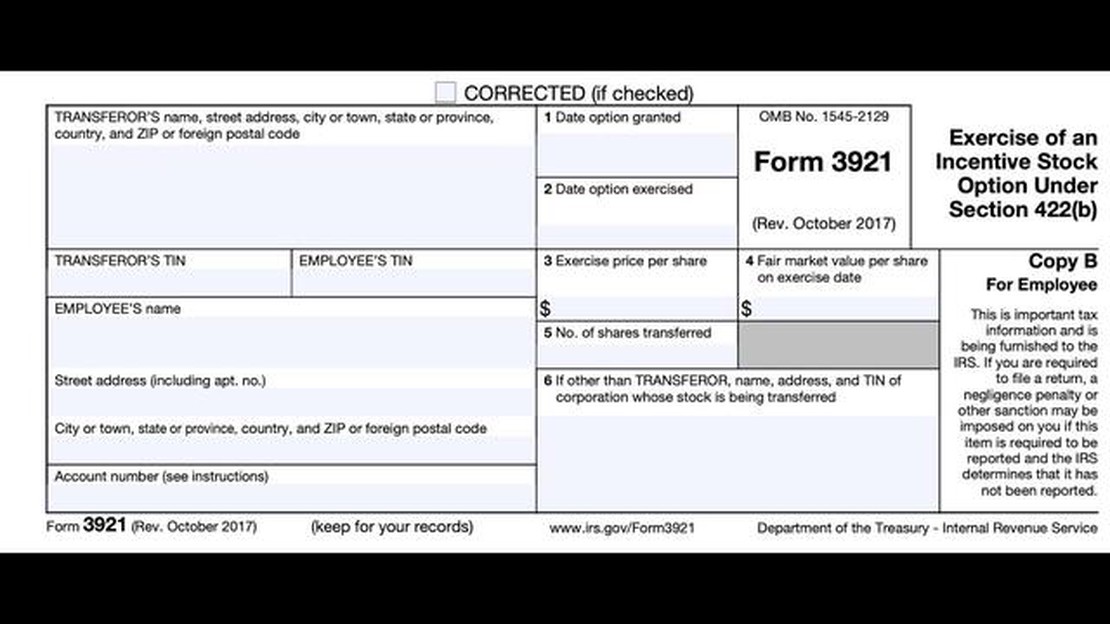
Understanding the 3921 Tax Form: A Comprehensive Guide Each year, taxpayers are required to file various tax forms to report their income, deductions, …
Read Article
When is the Best Time to Sell an Option Call? Options trading can be a complex and potentially profitable endeavor for investors. One key aspect of …
Read Article


