


Understanding the Distinction between Systematic and Discretionary Investing
Understanding the Distinction between Systematic and Discretionary Investing When it comes to investing, there are two main approaches that investors …
Read Article
In Excel, a moving weighted average is a useful tool for analyzing data trends over time. It allows you to assign different weights to different data points, reflecting their relative importance. This weighted average is then calculated over a moving window of data points.
To calculate the moving weighted average in Excel, there are a few steps you need to follow. First, you need to determine the number of data points in your moving window. This will depend on the frequency of your data and the length of time you want to analyze.
Next, you assign weights to each data point in the moving window. The weights can be based on any criteria you choose, such as the importance of the data point or its proximity to the current time period. You can assign higher weights to more recent data points, for example.
Once you have determined the number of data points and assigned the weights, you can calculate the moving weighted average using the SUMPRODUCT function in Excel. This function multiplies each data point by its corresponding weight, and then sums up the products to get the weighted average.
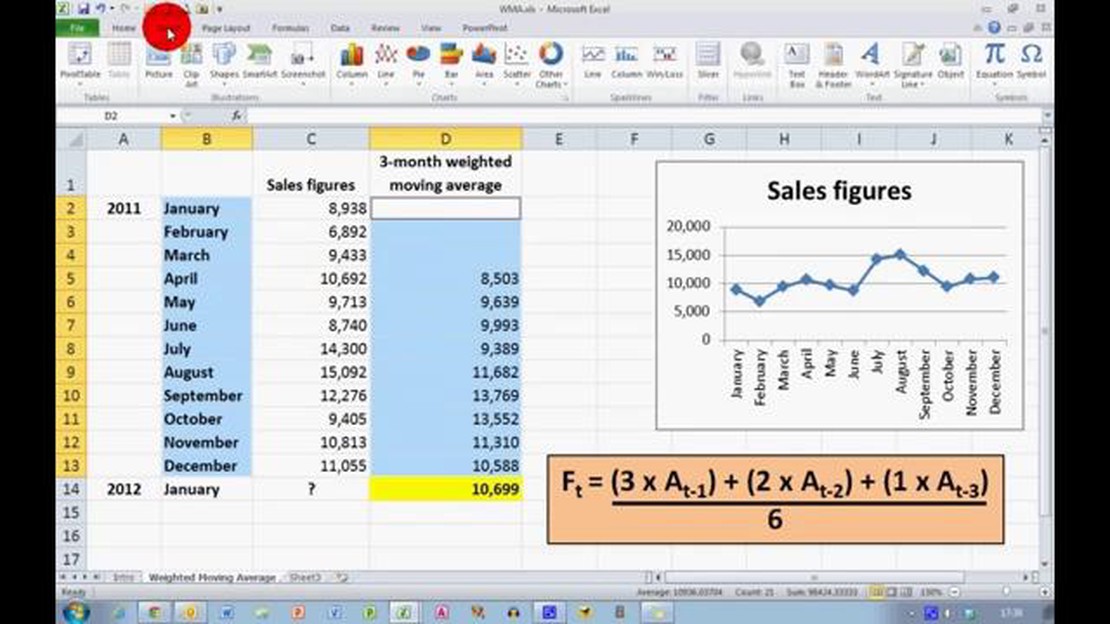
Moving Weighted Average is a statistical calculation used to analyze data points over a certain period of time. It is a way to summarize and identify trends in the data, especially when there is a need to give more weight to recent data points.

The Moving Weighted Average is calculated by multiplying each data point by a certain weight, and then summing up these weighted values. The weight assigned to each data point decreases as you move further back in time, giving more significance to the most recent data points.
For example, let’s say you want to calculate the moving weighted average of a stock’s price over the past 5 days. You would assign a higher weight to the most recent day’s price and a lower weight to the price from 5 days ago. The moving weighted average will give you a single value that represents the average price over the specified time period, taking into account the changing importance of each data point.
The Moving Weighted Average is commonly used in finance and economics to analyze stock prices, market trends, and economic indicators. It can also be applied to other fields where analyzing data over time is useful, such as sales forecasting, climate analysis, and population studies.
By calculating the Moving Weighted Average, you can gain insights into the overall trend and direction of the data, while minimizing the impact of outliers or random fluctuations in individual data points.
Key Points:
Read Also: Equation for the Autoregressive Moving Average Model
The moving weighted average is a statistical calculation used to analyze time series data. It provides a way to smooth out data fluctuations and highlight underlying trends. The moving weighted average assigns different weights to different data points based on their position in the time series to give more importance to recent data.
To calculate the moving weighted average, you need to multiply each data point by a weight and then sum up the products. The weights are usually assigned in a descending order, with the most recent data point having the highest weight. The weight values can be determined based on a specific formula or based on the analyst’s judgment.
The moving weighted average can be used in various fields, such as finance, economics, and marketing. It is particularly useful when analyzing time series data with irregular patterns and noise, as it helps generate a smoother line that reflects the overall trend. This can be beneficial for forecasting future values and identifying anomalies in the data.
Excel provides a convenient way to calculate the moving weighted average using built-in functions and formulas. By following a step-by-step guide, you can easily apply this technique to your own data and gain valuable insights.
Read Also: Is Teladoc a good investment: all you need to know before buying Teladoc stock
Calculating the moving weighted average in Excel allows you to analyze a data set and identify trends by giving more weight to recent data points. This can be especially useful when dealing with time-series data, where the more recent information is often more relevant.
To calculate the moving weighted average, you will need a data set and a set of weights. The weights determine the importance of each data point in the average calculation. The most recent data point typically has the highest weight, and the weight decreases as you move further back in time.
Here is a step-by-step guide on how to calculate the moving weighted average in Excel:
By following these steps, you can easily calculate the moving weighted average in Excel. This will enable you to analyze your data set and identify trends by giving more importance to recent data points.
To calculate the moving weighted average in Excel, you can use the SUMPRODUCT function along with the OFFSET function. First, determine the range of values you want to calculate the average for. Then, use the OFFSET function to dynamically adjust the range as you move through the data. Finally, multiply each value by its corresponding weight, sum these products, and divide by the sum of the weights.

Yes, you can calculate the moving weighted average using a fixed range of values in Excel. Instead of using the OFFSET function to dynamically adjust the range, simply specify the fixed range directly in the formula. The rest of the calculation process remains the same.
A moving weighted average allows you to give more weight to recent data points, making the average more representative of the current trend or pattern. This can be particularly useful when analyzing time series data or tracking trends over time.
Yes, you can change the weights for each data point in the moving weighted average calculation. By assigning different weights to each data point, you can emphasize certain points more heavily in the calculation. This can be useful if you want to give more importance to recent data or if you have specific criteria for assigning weights to each point.

Understanding the Distinction between Systematic and Discretionary Investing When it comes to investing, there are two main approaches that investors …
Read Article
Understanding Forex Quotes: How to Read and Interpret Them When trading in the foreign exchange market (forex), one of the most important aspects is …
Read Article
4 Types of Forex Traders: Exploring Different Trading Styles When it comes to forex trading, everyone has their own unique approach. Some traders …
Read Article
The Indus Valley Trade Economy: A Comprehensive Overview The Indus Valley civilization, which flourished from 2600 to 1900 BCE, was one of the world’s …
Read Article
Impact of Dilution on Stock Options Stock options are a popular form of compensation offered to employees and executives, allowing them to purchase …
Read Article
Step-by-Step Guide: Option Trading in Forex Welcome to the beginner’s guide to option trading in forex! This step-by-step tutorial will help you …
Read Article


