


Understanding the Net Open Position in Trading: A Comprehensive Guide
Understanding the Net Open Position in Trading When it comes to trading in the financial markets, understanding the concept of net open position is …
Read Article
The 4-week moving average is a popular technical analysis tool used by traders and investors to better understand the trends and patterns in financial data. By smoothing out short-term fluctuations, the moving average allows analysts to identify the underlying direction and momentum of a given data series.
In this step-by-step guide, we will walk you through the process of calculating a 4-week moving average. Whether you are a seasoned trader or just starting out, understanding how to calculate and interpret this important indicator can enhance your decision-making process.
To begin calculating a 4-week moving average, you will first need to gather the data points for the desired time period. This can be done by pulling historical data from reliable sources, such as financial websites or trading platforms. Once you have the data, you can proceed with the following steps.
By calculating a 4-week moving average, you can gain valuable insights into the overall trend of a data series and filter out short-term noise. This can help you make more informed decisions when it comes to trading or investing in financial markets. Remember to regularly update and adjust the moving average as new data becomes available to ensure its accuracy and relevance.
Disclaimer: The information provided in this article is for educational purposes only and should not be considered financial advice. Always do your own research and consult with a qualified financial professional before making any investment decisions.
A moving average is a statistical calculation used to analyze data over a certain period of time. It is commonly used in various fields, such as finance, economics, and stock market analysis, to smooth out fluctuations and identify trends within a set of data.
The moving average is calculated by taking the average of a set of values over a specific time period, or “window”. The window can be a fixed number of data points or a fixed time period, such as days, weeks, or months. The average is then recalculated for each consecutive window, resulting in a series of average values over time.
The purpose of using a moving average is to reduce the impact of random variations or noise in the data, which can make it difficult to identify underlying trends. By smoothing out these fluctuations, the moving average can provide a clearer picture of the overall direction or pattern in the data.
Read Also: Automating Trading with Zerodha: Everything You Need to Know
There are different types of moving averages, including simple moving average (SMA), exponential moving average (EMA), and weighted moving average (WMA). Each type has its own calculation method and can be used in different situations depending on the specific needs of the analysis.
Overall, a moving average is a valuable tool for analyzing and interpreting data, as it helps to identify trends, patterns, and potential changes in the data over time. It is a widely used technique in quantitative analysis and can be applied to various fields and industries.
| Advantages | Disadvantages |
|---|---|
| Smoothes out fluctuations in data | May lag behind sudden changes |
| Reveals underlying trends | Can be influenced by outliers |
| Reduces noise in the data | Does not predict future values |
The 4-week moving average is a useful calculation that helps to smooth out the fluctuations in data over a four-week period. It provides a clearer picture of the underlying trend and can be particularly helpful when analyzing time-series data.
There are several reasons why calculating a 4-week moving average may be beneficial:
| 1. Smoothing Data: | A moving average helps to remove the short-term fluctuations in data, providing a more stabilized and smoother trend line. This can be useful in identifying long-term patterns and trends. |
| 2. Identifying Seasonal Patterns: | By calculating a 4-week moving average, it becomes easier to identify seasonal patterns in the data. For example, if you are analyzing weekly sales data, a moving average can help to highlight any peaks or dips that occur at the same time each year. |
| 3. Forecasting: | The 4-week moving average can be used as a basis for forecasting future values. By analyzing the trend line and historical data, it is possible to make predictions about future performance. |
| 4. Analyzing Data: | Calculating a 4-week moving average can make it easier to analyze data by smoothing out noise and allowing for better comparisons between different time periods. This can be particularly useful when comparing data across different weeks or months. |
Read Also: Are Bollinger Bands and Keltner Channels the Same? A Comparative Analysis
In conclusion, a 4-week moving average is a useful tool for analyzing time-series data. It helps to smooth out fluctuations, identify seasonal patterns, make forecasts, and facilitate data analysis. By calculating and understanding the 4-week moving average, analysts can gain valuable insights and make more informed decisions based on trends and patterns in the data.
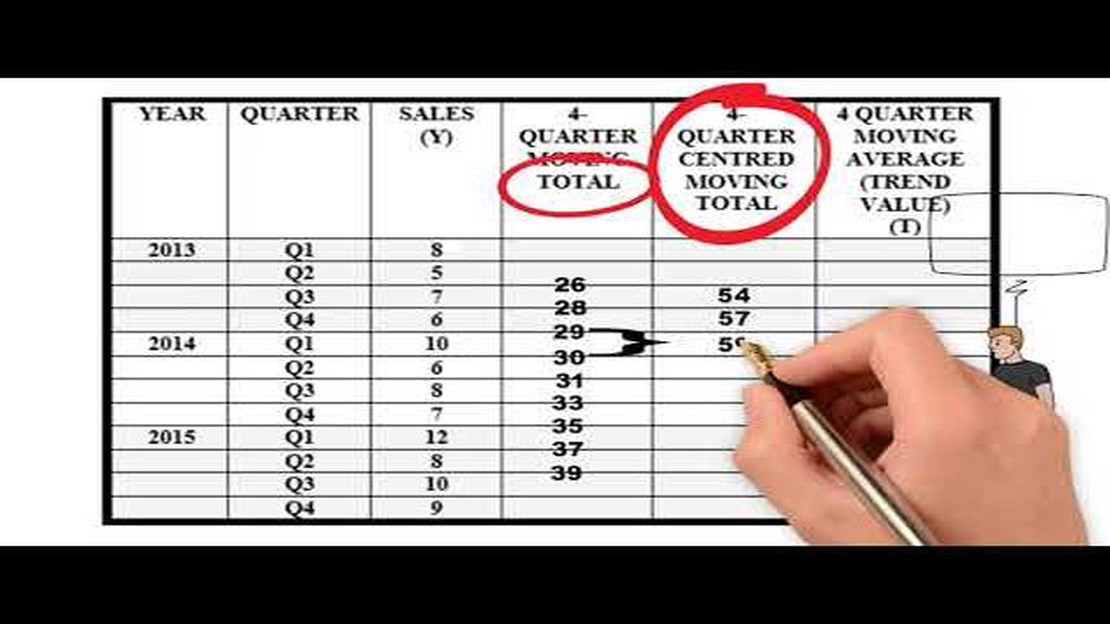
To calculate a 4-week moving average, you need to first gather the data points for the past four weeks. Then, add up those data points and divide the sum by 4. This will give you the average for the first week. To calculate the average for the second week, drop the oldest data point and add the newest one, then divide the sum by 4. Repeat this process for each week to calculate the 4-week moving average.
The purpose of calculating a 4-week moving average is to smooth out fluctuations in data and identify trends over a longer period of time. It can be particularly useful for tracking stock prices or other financial indicators, as it provides a clearer picture of the overall direction of the data.

Yes, you can use a different time period for the moving average. The 4-week moving average is just one example, but you can calculate moving averages for any time period you want. Some common time periods include 10 days, 50 days, and 200 days. The choice of time period depends on the specific data you’re analyzing and the level of smoothing you’re looking for.
The 4-week moving average is more suited for short-term analysis. It helps to smooth out short-term fluctuations and identify shorter-term trends. If you’re looking for long-term trends, you may want to consider using a longer time frame for your moving average, such as a 50-week or 200-week moving average.
While a moving average can help identify trends, it has some limitations. One limitation is that it lags behind the actual data, as it is based on past prices or values. This means that it may not accurately predict future movements. Additionally, moving averages can be affected by outliers or sudden changes in the data, which can distort the average. It’s important to consider these limitations and use moving averages in conjunction with other analysis techniques.

Understanding the Net Open Position in Trading When it comes to trading in the financial markets, understanding the concept of net open position is …
Read Article
How to Predict Forex Trends Forex trading is a highly volatile and ever-changing market. Traders who are able to accurately forecast the trends are …
Read Article
Trading in Nairobi Stock Exchange: A Step-by-Step Guide Investing in the stock market can be an effective way to grow your wealth and achieve your …
Read Article
Trading in Spot Price: A Comprehensive Guide Welcome to our comprehensive guide on spot price trading, where we will take you through everything you …
Read Article
Is Forex Free? Forex, or foreign exchange, is a decentralized market where individuals and institutions trade various currencies. Many people are …
Read Article
Understanding Forex in the Banking Industry Foreign exchange, or forex, plays a crucial role in the banking industry. It refers to the global market …
Read Article


