


Exploring the World of Listed Options Trading: Everything You Need to Know
Understanding the Basics of Listed Options Trading Are you curious about the world of listed options trading? Whether you’re an experienced investor …
Read Article
Bollinger Bands and Keltner Channels are two popular technical analysis indicators used by traders to identify potential price levels, trends, and market volatility. While both indicators are used to analyze market movements, they have different calculation formulas and interpretive methods.
Bollinger Bands were developed by John Bollinger in the 1980s. These bands consist of three lines placed on a price chart. The middle line is a simple moving average, while the upper and lower lines are calculated using standard deviations. Bollinger Bands are used to identify volatility and potential price reversals. When the price moves closer to the upper band, it indicates an overbought condition, while a move towards the lower band suggests an oversold condition. Traders often use Bollinger Bands to generate buy or sell signals.
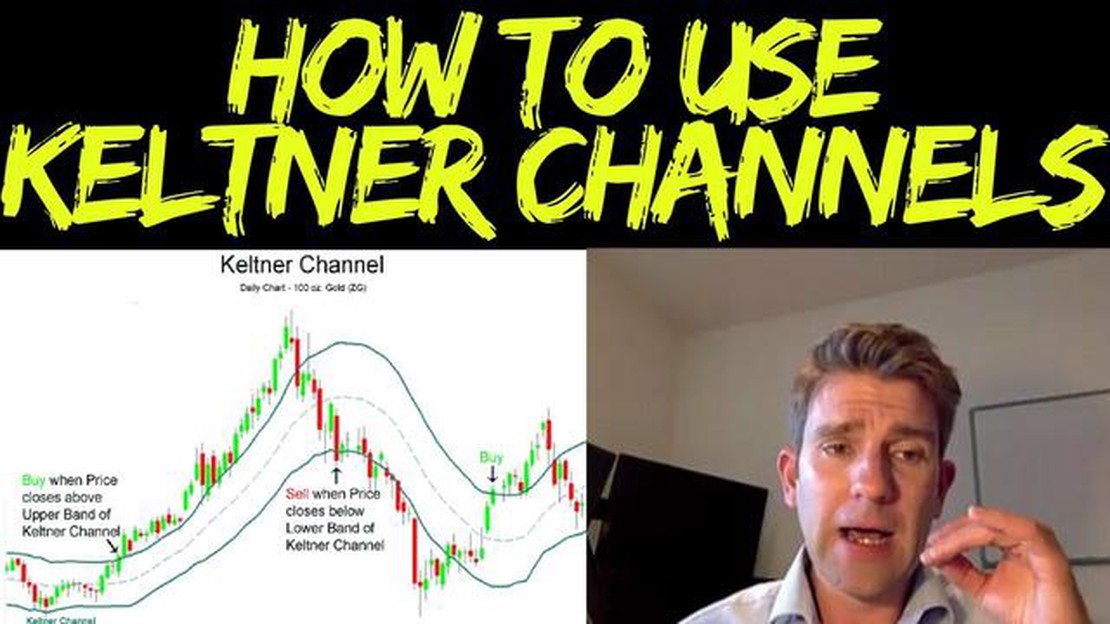
Keltner Channels, on the other hand, were developed by Chester Keltner in the 1960s. These channels consist of a middle line based on an average true range and two outer bands, which are calculated by adding or subtracting a multiple of the average true range from the middle line. Keltner Channels are used to identify price trends and potential breakouts. When the price moves outside the channel, it suggests a breakout or a significant price move. Traders often use Keltner Channels to set stop-loss orders or to identify potential entry or exit points.
While both indicators aim to provide valuable insights into market behavior, there are a few key differences between Bollinger Bands and Keltner Channels. Bollinger Bands are more focused on volatility and potential price reversals, while Keltner Channels are more focused on price trends and breakouts. Additionally, the calculations for the two indicators are different, with Bollinger Bands using standard deviations and Keltner Channels using average true ranges.
Traders may choose to use Bollinger Bands or Keltner Channels based on their individual trading strategies and preferences. Each indicator has its strengths and weaknesses, and it is important for traders to understand how they work and how to interpret their signals.
Ultimately, the choice between Bollinger Bands and Keltner Channels depends on a trader’s personal preference and trading style. Some traders may prefer the simplicity and focus on volatility provided by Bollinger Bands, while others may prefer the emphasis on price trends and breakouts offered by Keltner Channels. By understanding the characteristics and applications of both indicators, traders can make informed decisions and enhance their technical analysis.

When it comes to technical analysis in trading, Bollinger Bands and Keltner Channels are two widely used indicators. Both indicators are often used by traders to identify potential trend reversals, measure volatility, and generate entry and exit signals. However, there are some key differences between the two, and understanding these differences can help traders determine which indicator is best suited for their trading strategy.
Bollinger Bands consist of a middle band, which is a simple moving average, and an upper and lower band, which are standard deviations of the middle band. The width of the bands reflects volatility, with wider bands indicating higher volatility and narrower bands indicating lower volatility. When the price reaches the upper band, it is considered overbought, while reaching the lower band indicates oversold conditions. Traders often look for price bounces off the bands or a squeeze in the bands to signal potential trading opportunities.
Keltner Channels, on the other hand, consist of an exponential moving average, an upper channel line, and a lower channel line. The upper and lower channel lines are calculated by adding and subtracting a multiple of the Average True Range (ATR) from the moving average. Like Bollinger Bands, Keltner Channels can be used to identify overbought and oversold conditions, as well as potential trading opportunities when the price bounces off the channel lines.
One of the key differences between Bollinger Bands and Keltner Channels is the way they measure volatility. Bollinger Bands use standard deviations, which can be sensitive to extreme price moves, while Keltner Channels use the Average True Range, which is a more stable measure of volatility. This means that Keltner Channels may provide a smoother and less volatile representation of price movements compared to Bollinger Bands.
Another difference is the interpretation of the upper and lower bands. In Bollinger Bands, the upper and lower bands represent potential resistance and support levels, respectively. In Keltner Channels, the upper and lower channel lines are used to define the trading range, with price movements outside the channel lines indicating potential trend reversals.
Which indicator should a trader use? The answer depends on the trader’s trading style, risk tolerance, and the market conditions. Traders who prefer a smoother and less volatile representation of price movements may find Keltner Channels more suitable. On the other hand, traders who want to capture extreme price moves and identify potential support and resistance levels may prefer Bollinger Bands.
Read Also: Forex Market Opening Times Today: Everything You Need to Know
It is also worth noting that some traders may choose to use both indicators in combination to get a more comprehensive view of the market. By comparing the signals generated by both indicators, traders can potentially increase the accuracy of their trading decisions.
In conclusion, Bollinger Bands and Keltner Channels are both useful tools for technical analysis in trading. Each indicator has its own strengths and weaknesses, and it is up to the trader to determine which one best aligns with their trading strategy and objectives. Whether it is Bollinger Bands, Keltner Channels, or a combination of both, the key is to use these indicators as part of a well-rounded trading plan and to adapt to changing market conditions.
Read Also: Can Technical Analysis Really Help You Make Money?
Bollinger Bands are a popular technical analysis tool created by John Bollinger in the 1980s. They are used to measure the volatility of a financial instrument, such as a stock or currency pair, and help traders identify potential price trends and reversals.
The Bollinger Bands consist of three lines: the middle band, the upper band, and the lower band. The middle band is a simple moving average (SMA) of the price over a specified period of time, typically 20 days. The upper band is calculated by adding two standard deviations to the middle band, while the lower band is calculated by subtracting two standard deviations.
When the price moves towards the upper band, it suggests that the market is overbought. Conversely, when the price moves towards the lower band, it suggests that the market is oversold. Traders can use this information to anticipate potential price reversals and make buying or selling decisions.
Another use of Bollinger Bands is to identify the squeeze. The squeeze occurs when the range between the upper and lower bands narrows, indicating a period of low volatility. Traders often interpret this as a sign that a breakout is imminent, and they adjust their trading strategies accordingly.
It’s important to note that Bollinger Bands are not meant to be used in isolation but should be used in conjunction with other technical indicators and analysis techniques. They are most effective when combined with other tools such as trendlines, moving averages, and volume indicators.
In conclusion, Bollinger Bands are a powerful tool for technical analysis that helps traders identify potential price trends, reversals, and periods of low volatility. By understanding how to interpret and use Bollinger Bands, traders can make more informed trading decisions and improve their overall profitability.

Bollinger Bands and Keltner Channels are technical analysis tools used to measure volatility and identify potential trading opportunities in financial markets. Bollinger Bands consist of a middle band (usually a 20-day simple moving average) and two outer bands that are calculated based on the standard deviation of price movements. Keltner Channels, on the other hand, use an average true range to calculate the upper and lower channels.
The main difference between Bollinger Bands and Keltner Channels lies in the way the upper and lower bands are calculated. Bollinger Bands use the standard deviation of price movements, while Keltner Channels use the average true range. Additionally, Bollinger Bands are based on a simple moving average, whereas Keltner Channels use an exponential moving average.
The choice between Bollinger Bands and Keltner Channels depends on individual trading preferences and strategies. Both indicators are effective in measuring volatility and identifying potential trading opportunities. Some traders may prefer Bollinger Bands for their simplicity and ability to capture wide price swings, while others may prefer Keltner Channels for their smoother and less volatile signals.
Yes, Bollinger Bands and Keltner Channels can be used together to enhance trading signals. Some traders use Bollinger Bands to identify the overall trend and price extremes, and then use Keltner Channels to confirm entry and exit points. Combining these two indicators can provide a more comprehensive analysis of volatility and potential trading opportunities.
Bollinger Bands and Keltner Channels can be applied to various financial markets, including stocks, commodities, and currencies. However, it is important to note that the effectiveness of these indicators may vary depending on the market and individual securities. It is recommended to test and adapt these indicators to specific market conditions before making trading decisions.

Understanding the Basics of Listed Options Trading Are you curious about the world of listed options trading? Whether you’re an experienced investor …
Read Article
Discover the Fascinating World of Forex Trading Forex trading, also known as foreign exchange trading, is a popular and exciting investment option …
Read Article
Do big traders use stop loss? When it comes to trading in the financial markets, risk management is a crucial aspect that separates successful traders …
Read Article
Understanding Systematic Strategies Systematic strategies are an integral part of the financial world, providing investors with a structured approach …
Read Article
Ownership of Futures and Options in the Financial Markets A futures and options market is a complex ecosystem that involves various participants. …
Read Article
Understanding Dynamic Support and Resistance in Forex Trading In the world of forex trading, support and resistance levels play a crucial role in …
Read Article


