

How to consistently earn 100 pips daily in the forex market
How to Achieve 100 Pips Daily in Forex Trading? Trading in the forex market can be a highly profitable venture, but it requires a certain level of …
Read Article
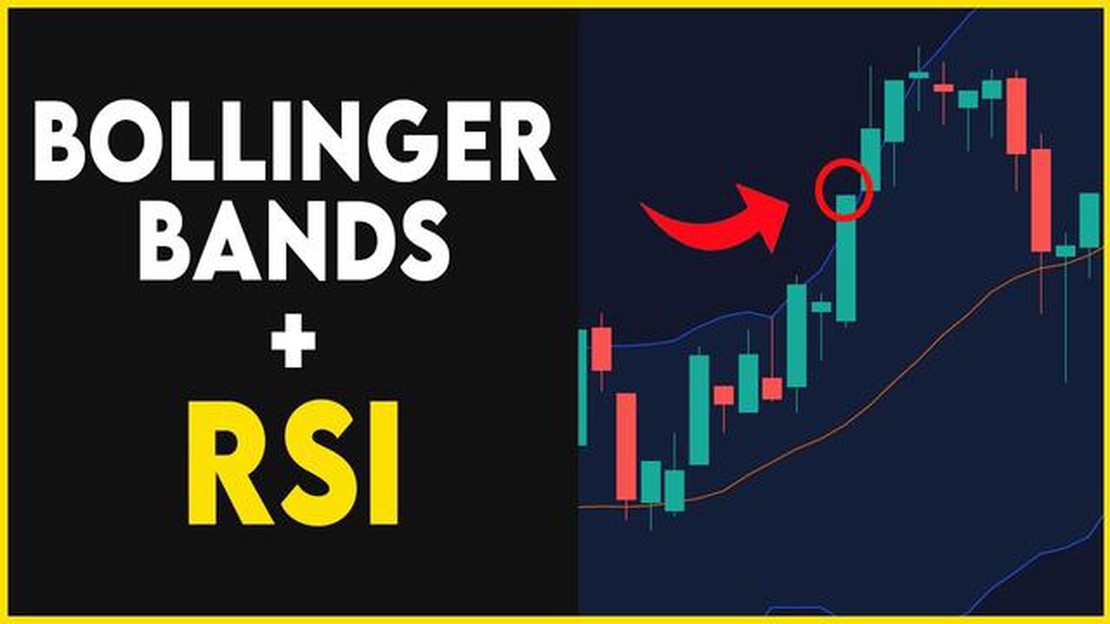
The Bollinger Bandwidth is a technical indicator available on the Tradingview platform that measures the volatility of a financial instrument. It is derived from the Bollinger Bands, which are a popular tool used by traders to identify potential price trends and reversals. The Bollinger Bandwidth can be used to determine the strength and intensity of market movements, as well as to spot potential trading opportunities.
To calculate the Bollinger Bandwidth, the formula subtracts the lower Bollinger Band value from the upper Bollinger Band value and divides the result by the middle Bollinger Band value. This value is then multiplied by 100 to express it as a percentage. The resulting value represents the bandwidth of the Bollinger Bands and gives an indication of the market’s volatility.
A high Bollinger Bandwidth indicates that the price is experiencing significant volatility, while a low Bollinger Bandwidth suggests that the market is relatively quiet. Traders can use this information to adjust their trading strategies accordingly. For example, a high Bollinger Bandwidth may indicate a potential breakout or trend reversal, while a low Bollinger Bandwidth may signal a period of consolidation or low volatility.
Tradingview provides various features and settings for the Bollinger Bandwidth indicator, allowing traders to customize it to their specific needs. Traders can adjust the number of periods used to calculate the Bollinger Bands, as well as the standard deviation multiplier. These settings can be modified depending on the trader’s preferred time frame and risk tolerance.
Overall, the Bollinger Bandwidth indicator on Tradingview is a valuable tool for traders looking to assess market volatility and identify potential trading opportunities. By understanding how to interpret and utilize this indicator, traders can gain an edge in the market and make more informed trading decisions.
Bollinger Bandwidth is a technical analysis tool that is built upon the Bollinger Bands indicator. It measures the width between the upper and lower bands of the Bollinger Bands, indicating the volatility in the market.
The Bollinger Bands consist of a middle band, which is a simple moving average, and an upper and lower band that represent standard deviations above and below the middle band. The Bollinger Bandwidth is calculated by dividing the difference between the upper and lower bands by the middle band.
Tradingview is a popular platform that provides a wide range of technical analysis tools, including the Bollinger Bandwidth indicator. It allows traders to plot the Bollinger Bandwidth on their charts and use it to identify periods of low volatility, which can indicate potential breakouts or reversals.

When the Bollinger Bandwidth is narrow, it suggests that the market is consolidating and volatility is low. Traders can use this information to prepare for a potential increase in volatility, as narrow bandwidths are often followed by periods of high volatility. Conversely, when the Bollinger Bandwidth is wide, it indicates that volatility is high, and traders can look for potential reversals or trend continuations.
The Bollinger Bandwidth can be used in combination with other technical indicators to confirm trading signals. For example, traders may look for a narrowing Bandwidth accompanied by a contraction in trading volume, which could indicate that a breakout is imminent.
Read Also: Understanding the Vega of a Binary Option: How it Affects Pricing and Volatility
| Advantages | Disadvantages |
|---|---|
| 1. Provides a visual representation of volatility. | 1. Can generate false signals during periods of low volatility. |
| 2. Can be used to identify potential breakouts or reversals. | 2. Should be used in conjunction with other indicators for confirmation. |
| 3. Customizable parameters allow traders to adjust for different market conditions. | 3. May not be suitable for all trading strategies. |
In conclusion, the Bollinger Bandwidth indicator on Tradingview is a valuable tool for traders to measure volatility and identify potential trading opportunities. However, it should be used in conjunction with other indicators and analysis techniques to increase the accuracy of trading signals. Traders should also be aware of the limitations and false signals that can occur when using the Bollinger Bandwidth.
Bollinger Bandwidth is a technical indicator used in financial analysis to measure the volatility of an asset’s price over a given period of time. It is derived from the popular Bollinger Bands indicator created by John Bollinger.
The Bollinger Bands consist of three lines: the middle band, which is a simple moving average; the upper band, which is the middle band plus a specified number of standard deviations; and the lower band, which is the middle band minus the same number of standard deviations.
The Bollinger Bandwidth indicator measures the distance between the upper and lower bands as a percentage of the middle band. It provides a quantitative measure of how wide or narrow the Bollinger Bands are, which is useful in identifying periods of low volatility and high volatility.
When the Bollinger Bands are narrow, the Bollinger Bandwidth value is low, indicating that the price is consolidating and volatility is low. Conversely, when the Bollinger Bands are wide, the Bollinger Bandwidth value is high, indicating that the price is experiencing high volatility.
Read Also: Is Money Changer a Lucrative Business? Find Out Here
Traders and investors can use the Bollinger Bandwidth to identify potential trading opportunities. For example, when the Bollinger Bandwidth is low, it may indicate that the price is about to break out of a consolidation phase, leading to a trend reversal or a significant price move. On the other hand, when the Bollinger Bandwidth is high, it may suggest that the price is reaching extreme levels and a reversal or retracement could occur.
The Bollinger Bandwidth can be used on various timeframes and can be customized by adjusting the number of standard deviations used in the calculation. It is often used in conjunction with other technical indicators and chart patterns to confirm trading signals and improve the accuracy of predictions.

The Bollinger Bandwidth indicator is a technical analysis tool that measures the volatility of a financial instrument. It is calculated by dividing the difference between the upper and lower Bollinger Bands by the middle band. This indicator can help traders identify periods of low volatility, which may be followed by periods of high volatility.
The interpretation of the Bollinger Bandwidth depends on the trader’s strategy and the current market conditions. Generally, a low Bollinger Bandwidth indicates low volatility and may signal a potential breakout or a period of consolidation. Conversely, a high Bollinger Bandwidth suggests high volatility and may indicate an upcoming trend reversal or a significant price move.
While the Bollinger Bandwidth can provide valuable information about market volatility, it is generally not recommended to use it as a stand-alone trading strategy. Traders often use the Bollinger Bandwidth in conjunction with other technical indicators or chart patterns to make more informed trading decisions.
Some common trading strategies that incorporate the Bollinger Bandwidth include the Bollinger Squeeze, which identifies periods of low volatility and anticipates a breakout, and the Bollinger Bandwidth Expansion, which attempts to capitalize on large price moves following a period of consolidation.
Yes, the Bollinger Bandwidth indicator is available on the TradingView platform. It can be added to a chart by selecting “Indicators” in the top navigation menu, searching for “Bollinger Bandwidth,” and clicking on the indicator name. Traders can then customize the indicator’s settings according to their preferences.
Bollinger Bandwidth is a technical indicator that measures the percentage difference between the upper and lower Bollinger Bands. It is used to determine the volatility of a security and identify potential trading opportunities.

How to Achieve 100 Pips Daily in Forex Trading? Trading in the forex market can be a highly profitable venture, but it requires a certain level of …
Read Article
How much does a composite terrace cost? When it comes to creating your ideal outdoor space, a composite terrace offers a durable and low-maintenance …
Read Article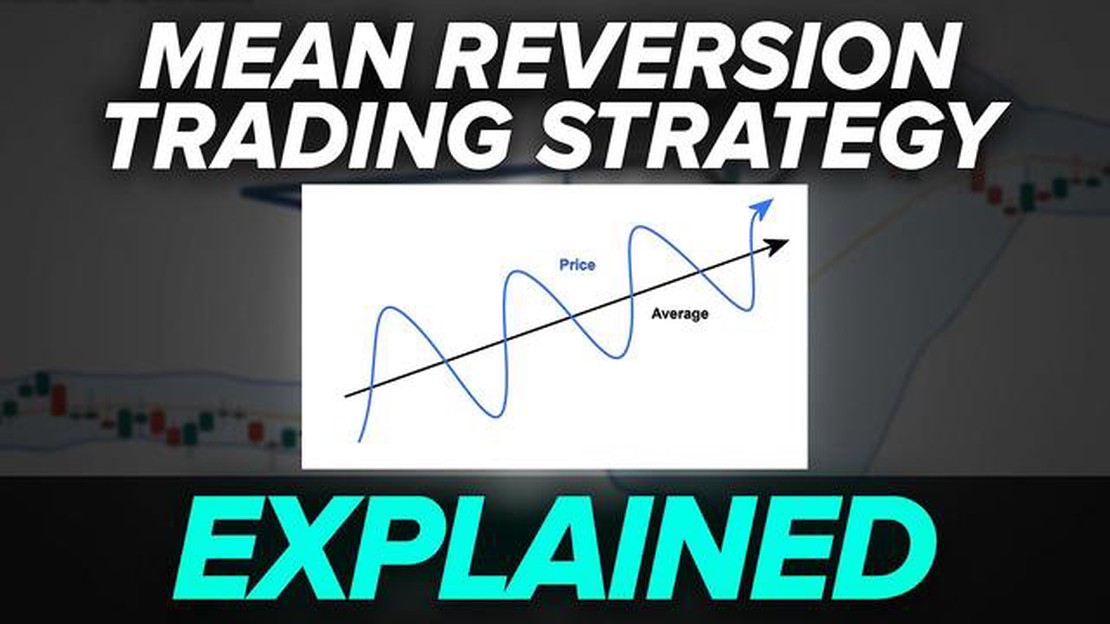
Understanding the Mean Reversion Trading System Mean Reversion trading is a popular strategy used by many traders and investors to profit from the …
Read Article
Minimum Deposit for CMC Markets UK When it comes to trading, one of the most important factors to consider is the minimum deposit required by the …
Read Article
How Does Option Trade Work? Option trading is a fascinating and complex world, filled with different strategies and terms that can seem overwhelming …
Read Article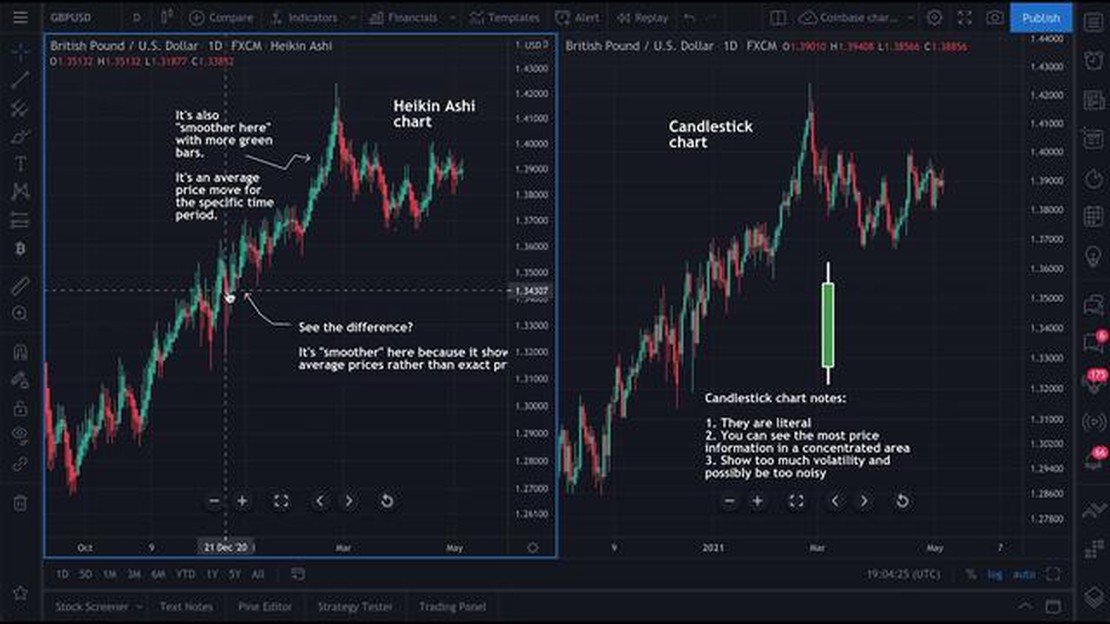
Comparing Heiken Ashi and Japanese Candlestick Charts: Which is Superior? When it comes to analyzing market trends and making informed trading …
Read Article


