

Understanding the Significance of the 200 Day Moving Average: A Complete Guide
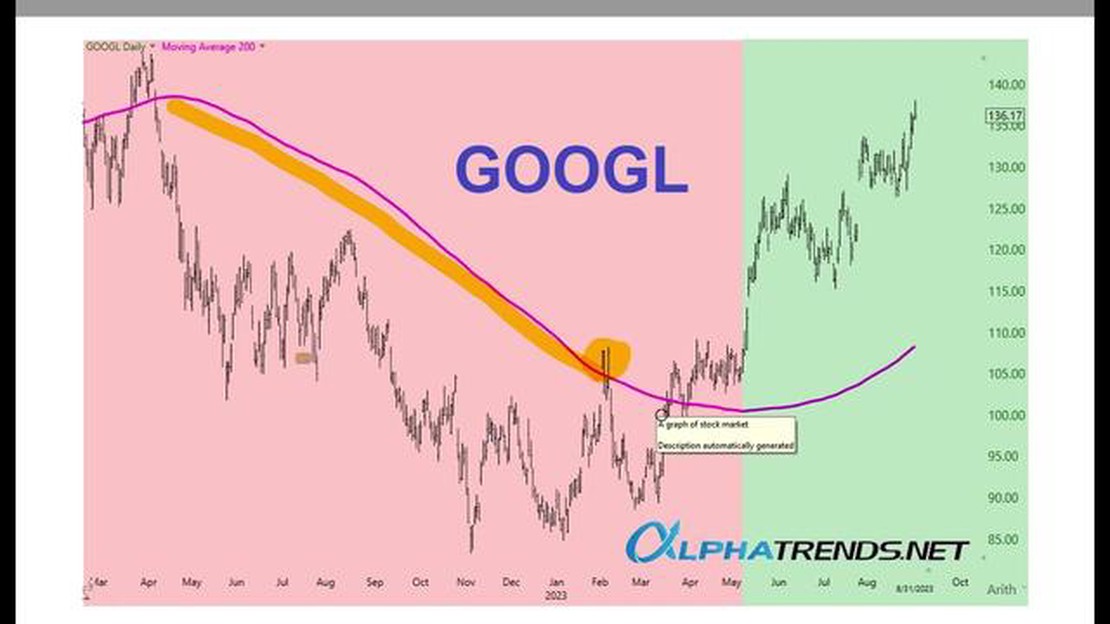
Understanding the Significance of the 200-Day Moving Average The 200-day moving average is a widely used technical indicator that provides valuable …
Read Article
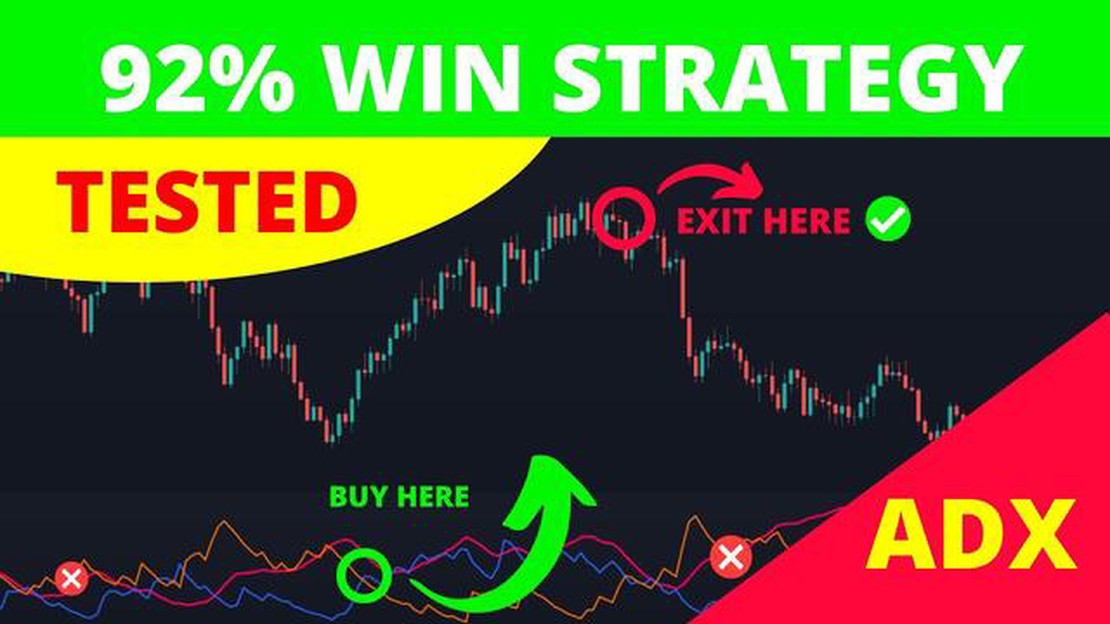
The Average Directional Movement Index (ADX) is a popular technical analysis indicator that is used to determine the strength of a trend. It measures the strength of a price movement in a particular direction, be it up or down. Traders often use the ADX indicator to identify an ongoing trend and to assess whether the trend is strong enough to warrant a trade.
The ADX indicator consists of three lines: the ADX line, the +DI line, and the -DI line. The ADX line represents the overall strength of the trend, while the +DI line and the -DI line show the strength of the positive and negative movements, respectively. When the ADX line is above a certain threshold (usually 25 or 30), it indicates that a trend is present.
Trading with the ADX indicator involves using the information provided by the three lines to make trading decisions. One common strategy is to wait for the ADX line to rise above the threshold level and then look for entry points when the +DI line crosses above the -DI line. This can signal the start of a strong upward trend. Conversely, when the +DI line crosses below the -DI line and the ADX line is above the threshold, it can be a signal to enter a short trade.
It’s important to note that the ADX indicator does not provide information about the direction of the trend, only its strength. Therefore, it is often used in combination with other indicators or chart patterns to confirm the direction of the trend before making a trade. Traders should also be aware that the ADX indicator is best suited for trending markets and may provide less reliable signals in range-bound or choppy markets.
In conclusion, the ADX indicator is a valuable tool for traders looking to identify and trade strong trends. By understanding how to interpret the ADX line, +DI line, and -DI line, traders can make informed decisions about when to enter or exit positions. However, it is always important to use the ADX indicator in conjunction with other technical analysis tools and to consider the overall market conditions before making a trade.
ADX Trading refers to a trading strategy that uses the Average Directional Index (ADX) indicator to identify and trade trends in the financial markets.

The ADX indicator is a technical analysis tool used to measure the strength and direction of a market trend. It is based on a mathematical formula that calculates the average movement of price over a specific period of time. The ADX value ranges from 0 to 100, with higher values indicating a stronger trend.
ADX Trading is commonly used in trend-following strategies, where traders aim to profit from the continuation of an existing trend. Traders typically enter long positions when the ADX is above a certain threshold (e.g., 25) and the market is trending upwards, and enter short positions when the ADX is above the threshold and the market is trending downwards.
ADX Trading can be used in various financial markets, including stocks, currencies, commodities, and indices. By identifying and trading trends, traders can potentially profit from the directional movement of the market.
It is important to note that while the ADX indicator is a useful tool for trend identification, it does not provide information about the timing of market entries or exits. Traders should use additional technical analysis tools and risk management strategies to determine their trading decisions.
In conclusion, ADX Trading is a trend-following strategy that uses the ADX indicator to identify and trade trends in the financial markets. By understanding the strength and direction of a market trend, traders can potentially profit from the ongoing trend movement.
Read Also: Understanding Rollover Fees: A Comprehensive Guide
The Average Directional Index (ADX) is a technical indicator developed by J. Welles Wilder to help traders identify the strength of a trend. It measures the strength of a trend regardless of its direction and can be used to identify both uptrends and downtrends.
The ADX is displayed as a line on a chart, typically below the price chart. The value of the ADX ranges from 0 to 100. A high ADX value indicates a strong trend, while a low ADX value suggests a weak trend or a sideways market.
Traders use the ADX to determine whether to enter or exit a trade and to gauge the strength of a trend. When the ADX is above a certain threshold, such as 25, it is believed that there is a strong trend in place, and traders may look for opportunities to enter or stay in the market. Conversely, when the ADX is below the threshold, it may indicate a weak trend or a consolidation, prompting traders to avoid entering trades or to exit existing positions.
| ADX Value | Trend Strength | Action |
|---|---|---|
| 0-25 | Weak or Non-existent | Avoid entering trades or consider exiting existing positions |
| 25-50 | Moderate | Consider entering trades or staying in existing positions |
| 50-75 | Strong | Look for opportunities to enter or stay in the market |
| 75-100 | Very Strong | Consider adding to existing positions or staying in the market |
Read Also: Understanding the IVX Volatility Index: What It Is and How It Works
In addition to the ADX line, the ADX indicator also includes two lines known as the positive directional movement index (+DI) and the negative directional movement index (-DI). These lines provide information about the direction of the trend. When the +DI line is above the -DI line, it suggests a bullish trend, and when the -DI line is above the +DI line, it indicates a bearish trend.
It is important to note that while the ADX can help traders identify the strength of a trend, it does not provide information about the direction of the trend. To determine the direction, traders can use other technical analysis tools in conjunction with the ADX indicator, such as trendlines, moving averages, or candlestick patterns.
Ultimately, understanding the ADX indicator can provide traders with valuable insights into the strength of a trend, helping them make more informed trading decisions.
The ADX (Average Directional Movement Index) is a technical indicator used in technical analysis to measure the strength of a trend in the market.
The ADX is calculated using the formula: ADX = Average of the DX over a specified period.

The ADX value indicates the strength of the trend. A high ADX value suggests a strong trend, while a low ADX value suggests a weak or non-existent trend.
The ADX indicator can be used in various ways in trading. It can be used to identify strong trends and filter out choppy or sideways markets. It can also be used to generate trading signals when the ADX crosses specific levels.
Yes, the ADX indicator can be used for all types of markets, including stocks, forex, commodities, and cryptocurrencies. It is a versatile indicator that can be applied to any liquid and trending market.
The ADX indicator, or Average Directional Index, is a technical analysis tool that is used to measure the strength of a trend. It does this by measuring the magnitude of price movements in a given trading instrument over a specified period of time.
The ADX indicator is calculated by taking the average of the positive and negative directional movement over a specified period of time. The result is then smoothed using a moving average to remove any noise and provide a more accurate measurement of the trend’s strength.

Understanding the Significance of the 200-Day Moving Average The 200-day moving average is a widely used technical indicator that provides valuable …
Read Article
Trading American Options in India: Everything You Need to Know If you’re an investor in India, you may be wondering whether you can trade American …
Read Article
How much does it cost to buy Procter & Gamble stock? Procter & Gamble, a multinational consumer goods corporation, is known for its wide range of …
Read Article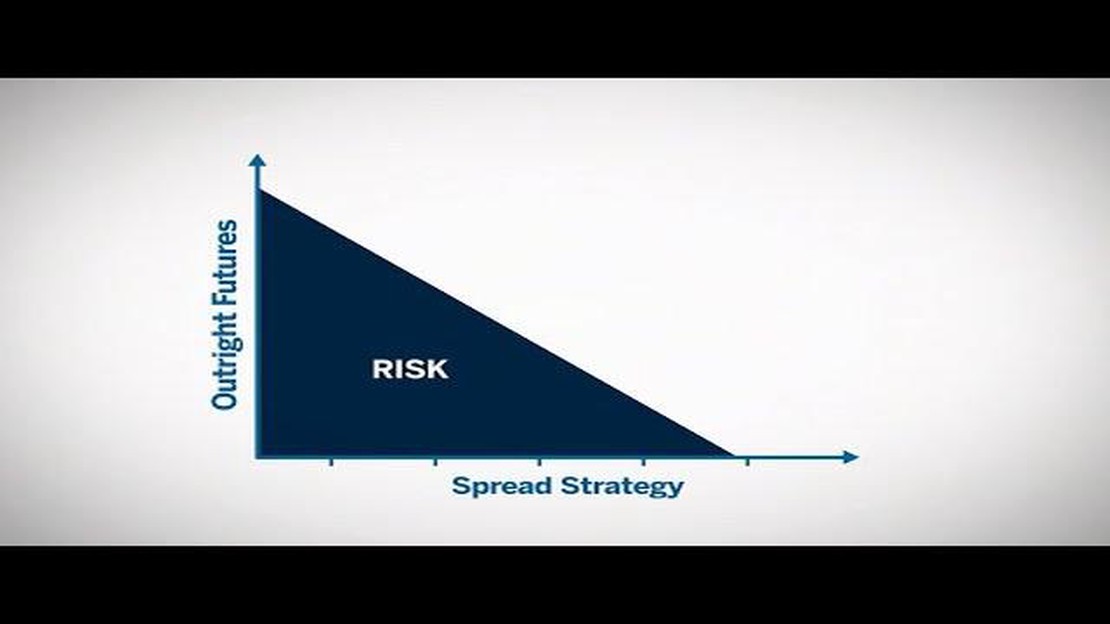
Understanding CME in Derivatives The world of derivatives can be complex and intimidating, especially when it comes to understanding the Commodity …
Read Article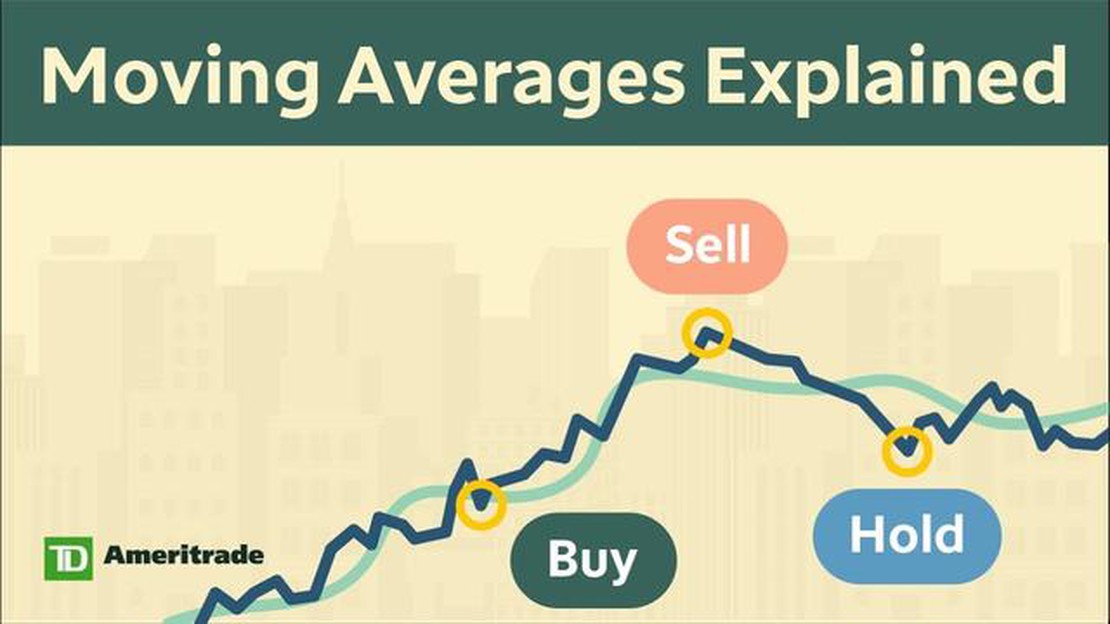
What is the moving average in the stock market? When it comes to trading in the stock market, understanding the moving average is crucial. The moving …
Read Article
Should I Exchange Money in Australia or NZ? When traveling to Australia or New Zealand, one of the most important considerations is how to exchange …
Read Article


