

2023 Australian Dollar to GBP Exchange Rate: What You Need to Know
What will be the average Australian Dollar to GBP exchange rate in 2023? The exchange rate between the Australian Dollar (AUD) and the Great British …
Read Article
When it comes to trading in the stock market, understanding the moving average is crucial. The moving average is a widely used indicator that helps traders assess the price trend of a stock or an index over a certain period of time. By smoothing out fluctuations in price data, the moving average provides a clearer picture of the overall direction of the market.
The concept of the moving average is simple. It calculates the average closing price of a stock or an index over a specified time frame, such as 10, 50, or 200 days. As new data becomes available, the oldest data point is dropped, and the newest data point is added, resulting in a constantly updated average.
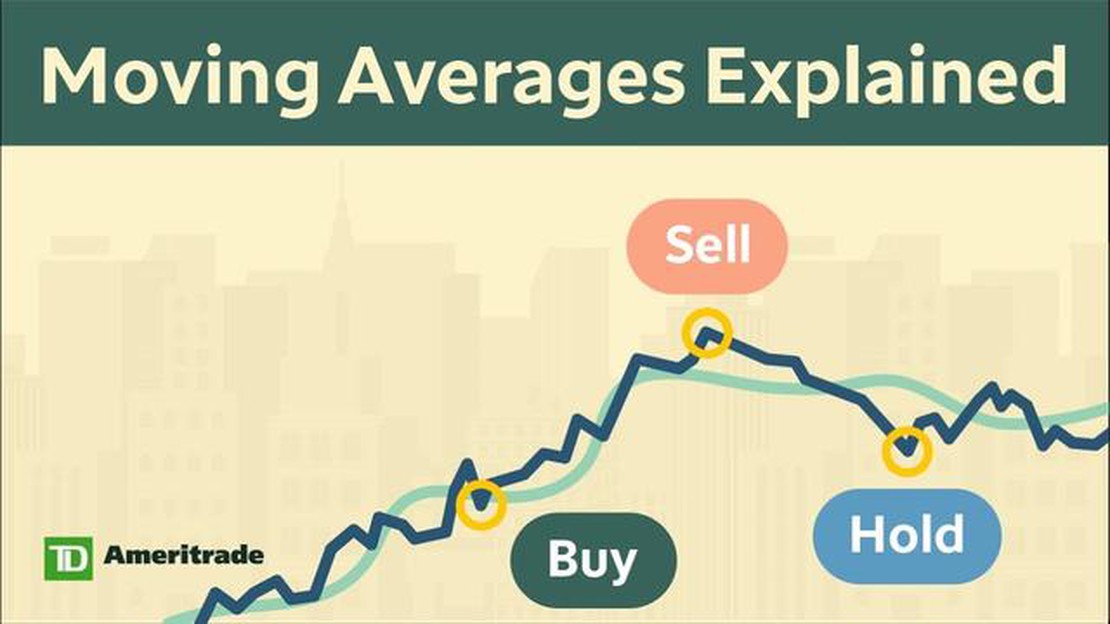
Traders rely on the moving average to identify trends and potential entry or exit points for their trades. When the price of a stock is above its moving average, it is considered to be in an uptrend, and traders may look for opportunities to buy. Conversely, when the price is below the moving average, it is seen as a downtrend, and traders might consider selling or shorting the stock.
The moving average is a versatile tool that can be used in combination with other indicators to develop trading strategies. By understanding how it works and why it matters, traders can gain insights into the market trends and make more informed decisions.
A moving average is a commonly used technical indicator in the stock market that helps investors and traders analyze price trends. It is calculated by taking the average price of a security over a specified period of time, typically the closing prices of each trading session.
The moving average is called “moving” because it constantly updates as new data becomes available. As each new data point is added, the oldest data point is dropped, which creates a “moving” effect.
The significance of the moving average lies in its ability to smooth out short-term price fluctuations and highlight the overall direction of the market. By plotting the moving average on a stock chart, traders can easily identify trends and potential buy or sell signals.
There are different types of moving averages, such as simple moving average (SMA) and exponential moving average (EMA), each with its own calculation method. The choice of which moving average to use depends on the trader’s preference and trading strategy.
Traders often use moving averages in combination with other technical indicators to confirm signals and make more informed trading decisions. For example, a crossover between a short-term moving average and a long-term moving average is commonly used as a signal for a trend reversal.

Overall, understanding and utilizing moving averages can be a valuable tool for investors and traders in navigating the stock market and making more informed decisions based on price trends.
The moving average is a commonly used technical analysis tool in the stock market. It is a calculation that helps smooth out fluctuations in price data to identify trends over a specific period of time.
Read Also: Beginner's Guide: How to Trade in NIFTY Options Successfully
There are different types of moving averages, but the simplest and most widely used is the simple moving average (SMA). The SMA is calculated by adding up the closing prices of a stock over a certain number of time periods and then dividing that total by the number of periods. For example, if you are using a 20-day SMA, you would add up the closing prices for the past 20 days and divide that sum by 20.
The moving average is called “moving” because it is recalculated with each new data point. As new data is added, the oldest data is dropped, and the average is recalculated based on the remaining data points.
The moving average can be used in different ways to analyze stock price trends. One common strategy is to compare the current price of a stock to its moving average. If the stock price is consistently above the moving average, it may indicate an uptrend, while if the stock price is consistently below the moving average, it may indicate a downtrend.
Traders and investors also use different time periods for their moving averages depending on their trading style and objectives. Shorter moving averages, such as the 50-day or 200-day SMA, are commonly used for identifying short-term trends, while longer moving averages, such as the 200-day or 50-week SMA, are used for identifying long-term trends.
It is important to note that moving averages are lagging indicators, which means they are based on past data. They are not predictive of future price movements but rather help to confirm or support the current trend.
The moving average is an important tool in the stock market because it helps to smooth out short-term fluctuations and provides a clearer picture of the overall trend. It is essentially a line that represents the average price of a security over a specific time period. Traders and investors use moving averages to identify potential buy or sell signals and make informed decisions.
Read Also: Learn about Robert Kiyosaki's views on forex trading
One of the main reasons why moving average is important is its ability to filter out noise and random price movements. The stock market is known for its volatility and price swings, which can sometimes be misleading. By calculating the moving average, traders can get a more reliable measure of the long-term trend.
Furthermore, moving averages can be used to identify support and resistance levels. When the price of a security moves above its moving average, it is considered a bullish signal, indicating that the stock may continue to rise. On the other hand, when the price falls below the moving average, it is seen as a bearish signal, suggesting that the stock may continue to decline.

Another reason why moving averages are important is their ability to generate buy and sell signals. Traders often use a combination of different moving averages, such as the 50-day, 100-day, and 200-day moving averages, to generate trading signals. For example, when the shorter-term moving average crosses above the longer-term moving average, it is seen as a buy signal, while a cross below is considered a sell signal.
Overall, moving averages are important in the stock market because they provide traders and investors with a better understanding of the underlying trends and help them make more informed decisions. By smoothing out short-term fluctuations and identifying support and resistance levels, moving averages can be a valuable tool for identifying potential trading opportunities.
A moving average in the stock market is a calculation that helps to identify trends by smoothing out the fluctuations in stock prices over a specific period of time.
A moving average is calculated by adding together a set of prices over a specific period and then dividing the sum by the number of prices in the set.
The moving average is important in the stock market because it helps investors and traders to better understand the overall trend of a stock’s price. It can also be used as a signal for buying or selling stocks.
There are different types of moving averages, such as the simple moving average (SMA) and the exponential moving average (EMA). The SMA gives equal weight to all prices in the period, while the EMA puts more weight on recent prices.
A moving average can be used to make trading decisions by comparing the current price of a stock to its moving average. If the price is above the moving average, it can be seen as a bullish signal, and if the price is below the moving average, it can be seen as a bearish signal.

What will be the average Australian Dollar to GBP exchange rate in 2023? The exchange rate between the Australian Dollar (AUD) and the Great British …
Read Article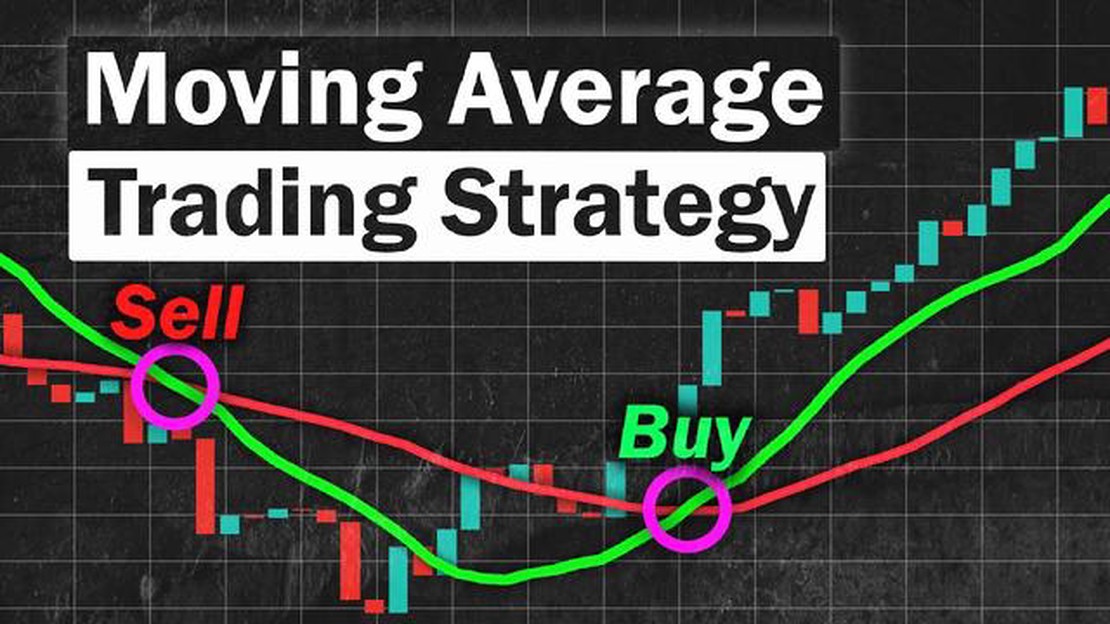
EMA Settings for Forex Trading When it comes to forex trading, one of the most popular technical indicators used by traders is the Exponential Moving …
Read Article
Automating Forex Trading: A Comprehensive Guide In today’s fast-paced financial markets, manual trading can be time-consuming and prone to human …
Read Article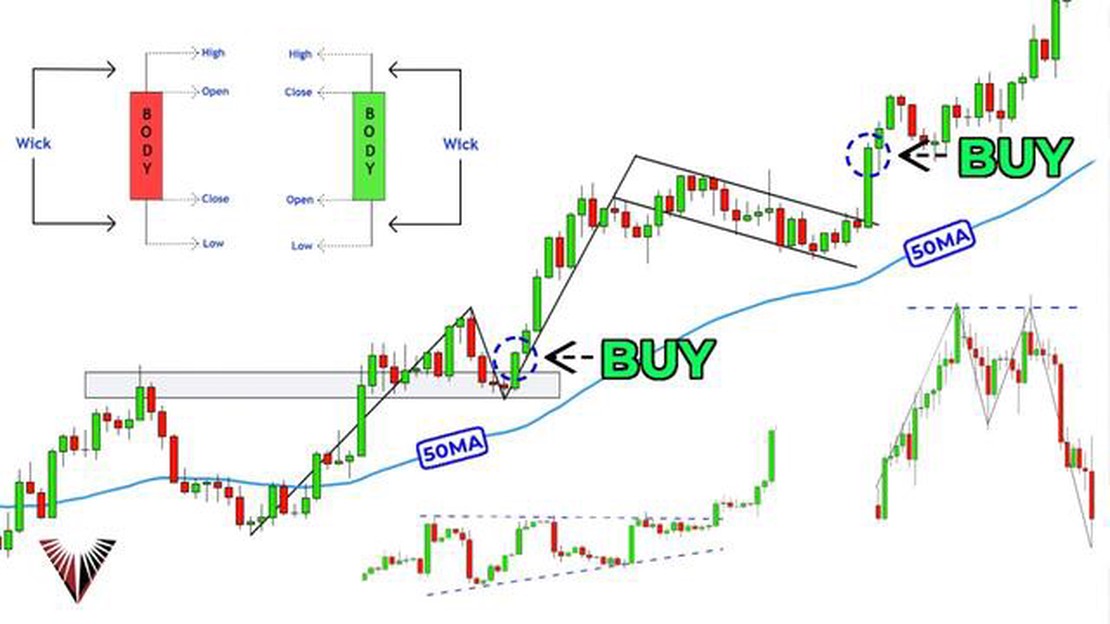
Understanding trade analysis Trade analysis is an essential tool for businesses and economists alike. It involves the examination of import and export …
Read Article
What is the Price of 1k of Silver? Silver is a precious metal that has been used for thousands of years as a medium of exchange, a store of value, and …
Read Article
How much does the QQQ move per day? When it comes to investing in the stock market, one of the most popular options for traders and investors is the …
Read Article


