

Understanding the Screen Based Trading System: A Comprehensive Guide
Screen Based Trading Systems: Understanding the Functioning and Benefits Welcome to our comprehensive guide on the screen-based trading system. In …
Read Article
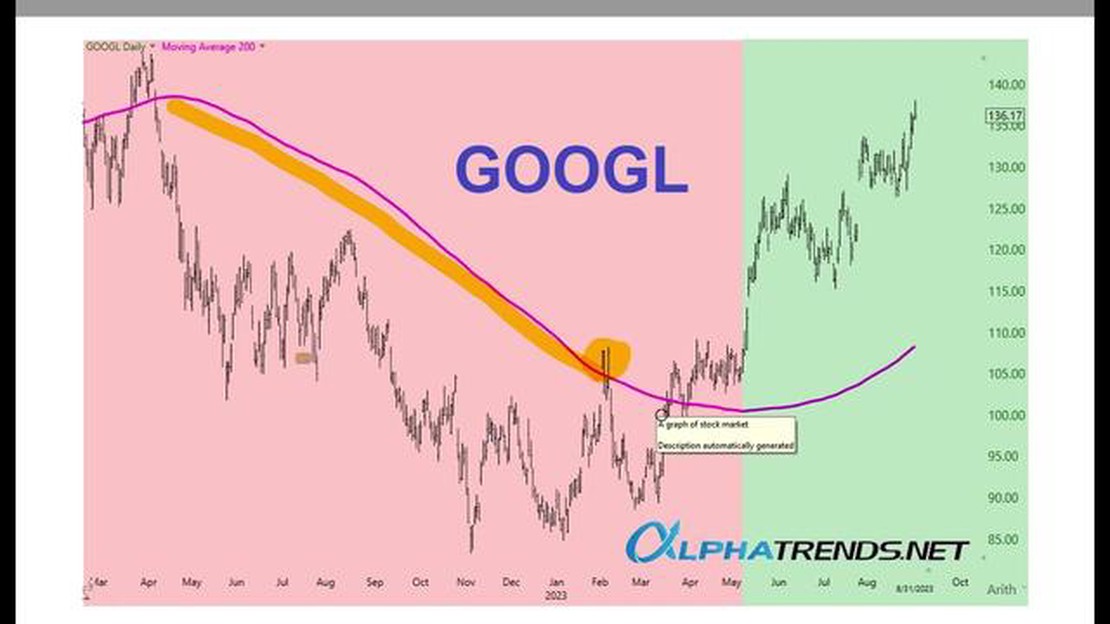
The 200-day moving average is a widely used technical indicator that provides valuable insights into price trends and market sentiment. It is an average of a security’s closing price over the past 200 trading days, which is approximately equivalent to a year’s worth of data.
This moving average is considered a crucial tool by traders and investors as it helps them identify the long-term trend of a particular security. When the price is above the 200-day moving average, it is generally seen as bullish, indicating a potential uptrend. On the other hand, when the price falls below the 200-day moving average, it is often interpreted as bearish, suggesting a possible downtrend.
The significance of the 200-day moving average lies in its ability to smooth out short-term fluctuations in price, providing a clearer picture of the overall trend. It helps filter out market noise and enables traders to make more informed decisions based on the long-term market direction.
Moreover, the 200-day moving average is also used as a key support and resistance level. When a security’s price approaches the 200-day moving average, it often experiences increased buying or selling pressure, resulting in a potential reversal or continuation of the existing trend.
It is important to note that the 200-day moving average should not be used in isolation but in conjunction with other technical indicators and analysis techniques. It is just one tool among many that can help traders and investors navigate the complex world of financial markets.
The 200 Day Moving Average is a commonly used technical analysis tool that helps traders and investors understand the long-term trend of a particular asset or security. It is calculated by averaging the closing price of the asset over the past 200 trading days.
This moving average is considered significant because it provides a smoothed representation of the price movement over a longer time frame, thereby reducing the impact of short-term price fluctuations. By focusing on the long-term trend, traders can effectively identify the overall direction of the market and make more informed trading decisions.
The 200 Day Moving Average is often used as a support or resistance level. When the price of the asset is above the moving average, it is considered a bullish signal, indicating that the asset is in an uptrend. Conversely, when the price is below the moving average, it is seen as a bearish signal, suggesting that the asset is in a downtrend.
In addition to identifying the trend, the 200 Day Moving Average can also be used as a tool for determining entry and exit points. For example, traders may choose to buy an asset when the price crosses above the moving average, indicating a potential trend reversal or a continuation of an existing uptrend. On the other hand, they may decide to sell when the price falls below the moving average, signaling a possible downtrend.
It is important to note that the 200 Day Moving Average is not a standalone indicator and should be used in conjunction with other technical analysis tools and indicators to confirm trading signals. It is also worth mentioning that different time frames, such as the 50 Day Moving Average or the 100 Day Moving Average, can be used depending on the trader’s preference and the specific asset being analyzed.

| Advantages | Disadvantages |
|---|---|
| Provides a long-term perspective of the market | May lag behind recent price movements |
| Helps filter out short-term noise and volatility | Not suitable for short-term trading strategies |
| Can be used as a support or resistance level | May generate false signals in choppy or sideways markets |
Overall, the 200 Day Moving Average is a valuable tool for understanding the long-term trend of an asset. By analyzing the moving average alongside other technical indicators, traders can gain a comprehensive view of the market and make more informed trading decisions. However, it is important to remember that no single indicator can guarantee success in the market, and it is always advisable to use a combination of tools and analysis methods.
A moving average is a commonly used technical indicator in financial markets. It is a calculation that helps to identify trends by smoothing out the price data over a specified time period. The moving average is calculated by taking the average of a specified number of data points over a specific period of time.
Read Also: Why is the Chinese yuan cheap? Factors that contribute to the low value of the yuan
For example, if we want to calculate a 200-day moving average, we would take the closing prices of the last 200 days and then calculate the average. Each day, we add the latest closing price to the calculation and drop the oldest closing price. This creates a constantly updated average that represents the overall trend over the past 200 days.
The moving average is often used as a line on a price chart. Traders and investors look at the relationship between the price and the moving average to determine the direction of the trend. If the price is above the moving average, it is considered bullish, indicating an uptrend. If the price is below the moving average, it is considered bearish, indicating a downtrend. The moving average can also act as a support and resistance level, where the price tends to bounce off or reverse at the moving average.
There are different types of moving averages, including simple moving averages (SMA), exponential moving averages (EMA), weighted moving averages (WMA), and displaced moving averages (DMA). Each type of moving average has its own calculation method and characteristics, but the concept remains the same - to smooth out price data and help identify trends.
Moving averages are widely used by traders and investors to generate trading signals and make informed decisions. They can be used on various timeframes, ranging from short-term intraday charts to long-term monthly charts. The choice of the moving average period depends on the trader’s or investor’s time horizon and trading strategy.
The 200-day moving average is a technical analysis tool that is widely used by traders and investors to analyze market trends and make informed decisions. It is calculated by taking the average closing price of a stock or an index over the past 200 trading days and plotting it on a chart.
One of the key roles of the 200-day moving average is to identify the direction of the long-term trend. If the price of a stock or an index is above its 200-day moving average, it is considered to be in an uptrend, indicating that the overall sentiment is bullish. Conversely, if the price is below the 200-day moving average, it suggests a downtrend and a bearish sentiment in the market.
Read Also: The Future of the GBP: Predicting the Path of the British Pound
The 200-day moving average also acts as a support or resistance level in the market. When the price is above the 200-day moving average, it tends to act as a support, preventing the price from dropping further. On the other hand, when the price is below the 200-day moving average, it can act as a resistance, capping the upside potential.
Traders and investors use the 200-day moving average as a benchmark to determine the strength of a trend. If the price of a stock or an index consistently stays above or below the 200-day moving average, it is a sign of a strong and persistent trend. Conversely, if the price frequently crosses above or below the 200-day moving average, it suggests a weak and choppy market.
Furthermore, the 200-day moving average is also used in conjunction with other technical indicators to generate trading signals. For example, when the price crosses above the 200-day moving average, it is considered a bullish signal, indicating a potential buying opportunity. Conversely, when the price crosses below the 200-day moving average, it is a bearish signal, indicating a potential selling opportunity.

In summary, the 200-day moving average plays a crucial role in technical analysis. It helps traders and investors identify the direction of the long-term trend, acts as a support or resistance level, determines the strength of a trend, and generates trading signals. By understanding the significance of the 200-day moving average, traders and investors can make more informed decisions and improve their trading strategies.
The 200-day moving average is a technical indicator used by traders and investors to analyze price trends in stocks or other assets over a period of 200 days.
The 200-day moving average is calculated by taking the average closing price of an asset over the past 200 trading days.
The 200-day moving average is important because it is widely regarded as a key support or resistance level. It can help traders identify potential buy or sell signals and provide insight into the overall trend of an asset.
While the 200-day moving average is primarily used for long-term trend analysis, it can also be applied to short-term trading strategies. Traders may look for temporary price dips or bounces off the 200-day moving average as potential entry or exit points.
The 200-day moving average alone is not a foolproof predictor of future price movements, as it is based on past data. However, when combined with other technical indicators and analysis methods, it can be a valuable tool in identifying potential trends and reversals.
A 200-day moving average is a technical indicator used in trading and investing to smooth out the price data and identify the overall trend of a security over a longer time period. It is calculated by taking the sum of the closing prices of the security over the past 200 trading days and dividing it by 200.
The 200-day moving average is significant because it is a widely followed technical indicator that is considered to be a strong gauge of the market’s overall trend. When a security’s price is above its 200-day moving average, it is generally considered to be in an uptrend, indicating it may be a good time to buy. On the other hand, when a security’s price is below its 200-day moving average, it is generally considered to be in a downtrend, indicating it may be a good time to sell.

Screen Based Trading Systems: Understanding the Functioning and Benefits Welcome to our comprehensive guide on the screen-based trading system. In …
Read Article
Can I trade options with RBC? If you’re wondering whether you can trade options on RBC, you’ve come to the right place. Table Of Contents Can You …
Read Article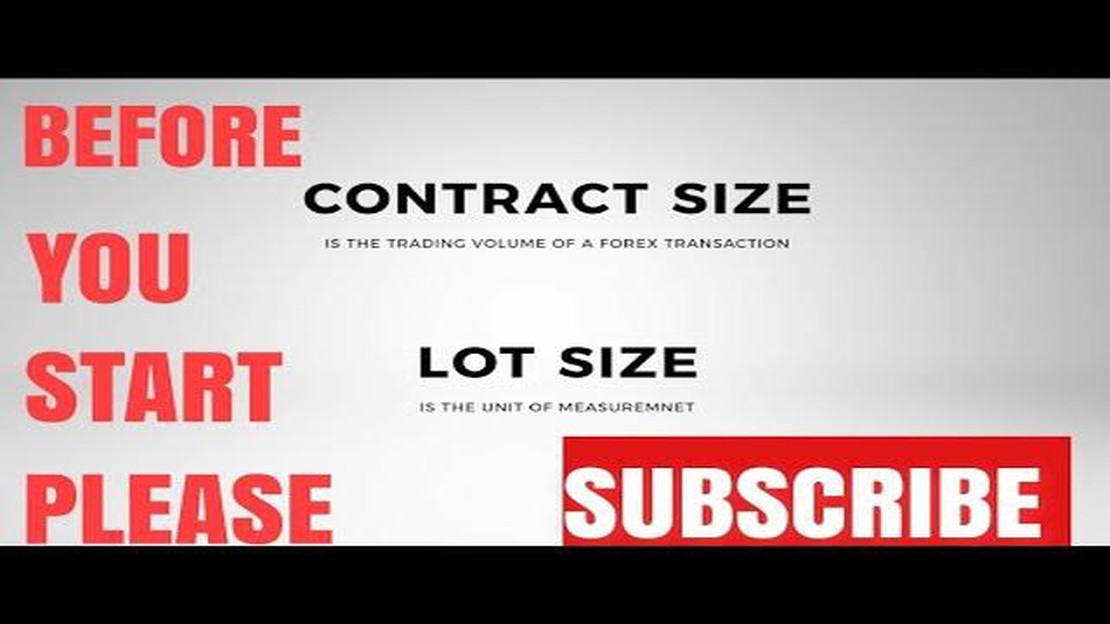
What is the size of the FX futures contract? The Foreign Exchange (FX) market is the largest and most liquid financial market in the world. It …
Read Article
Reasons for the ban of MT5 and its implications The ban on MetaTrader 5 (MT5) and its implications have become a topic of concern among traders and …
Read Article
Should You Exercise Options Early or Late? When it comes to stock options, many investors find themselves faced with the question of whether to …
Read Article
Effective Strategies for Advertising Binary Options In an increasingly competitive market, advertising binary options requires a strategic approach. …
Read Article


