

Understanding the Cost of VPS for Forex Trading: Unveiling the Best Options
Cost of VPS for forex trading Forex trading has gained immense popularity in recent years, attracting traders from all walks of life. Whether you are …
Read Article
The S&P 500 Index is one of the most widely followed stock market indices in the world. It is a market-capitalization weighted index of the 500 largest publicly traded companies in the United States. The S&P 500 is considered a benchmark for the performance of the U.S. stock market and is frequently used by investors, analysts, and economists to gauge the overall health of the economy at the corporate level.
Created in 1957, the S&P 500 is maintained by the S&P Dow Jones Indices, a division of S&P Global. The companies included in the index are chosen based on certain criteria, such as size, liquidity, and industry representation. The S&P 500 is designed to provide a comprehensive and unbiased snapshot of the U.S. stock market by representing a diverse range of sectors and industries.
The S&P 500 is a float-adjusted market-value index, which means that the index is not simply calculated by adding up the stock prices of its component companies. Instead, the index takes into account factors such as stock splits, dividends, and changes in the number of shares outstanding. This helps ensure that the index accurately reflects the performance of the underlying companies.
It’s important to note that the S&P 500 is not an investment itself, but rather a measure of the stock market’s performance. Investors can use the index as a benchmark to compare the performance of their own portfolios, or they can invest in index funds or exchange-traded funds (ETFs) that track the S&P 500.
Overall, the S&P 500 plays a crucial role in the world of investing and finance. Its broad representation of the U.S. stock market makes it a valuable tool for investors and analysts alike. By tracking the performance of the S&P 500, market participants can gain insights into the overall health and direction of the U.S. economy at the corporate level.
In the field of finance, the S&R level stands for support and resistance level. These levels play a crucial role in technical analysis and are used by traders and investors to make informed decisions in the financial markets.
The support level represents a price level at which the demand for a particular security or asset is strong enough to prevent it from falling further. It acts as a floor and provides a buffer against further price declines. Traders often see the support level as a buy signal, as they believe that the security’s price is unlikely to fall below that level.

On the other hand, the resistance level represents a price level at which the supply for a particular security or asset is strong enough to prevent it from rising further. It acts as a ceiling and provides a barrier against further price increases. Traders often see the resistance level as a sell signal, as they believe that it will be difficult for the security’s price to break above that level.
The S&R level is important because it helps traders and investors identify key levels at which the price of a security or asset might reverse its trend. By analyzing historical price data and identifying previous support and resistance levels, traders can anticipate potential price movements and make more informed decisions.
Furthermore, the S&R level can also be used to set stop-loss orders and take-profit targets. Traders often place their stop-loss orders just below the support level to limit their potential losses if the price breaks below it. They may also set their take-profit targets just below the resistance level to secure profits if the price fails to break above it.
| Support Level | Resistance Level |
|---|---|
| Acts as a floor | Acts as a ceiling |
| Buy signal | Sell signal |
| Prevents further price declines | Prevents further price increases |
Read Also: What is the Optimal Moving Average Volume?
The S&R level, also known as the stop and reverse level, is a technical analysis indicator used in trading. It is based on the concept of price momentum and is used to determine potential entry and exit points in the market.
The S&R level is calculated by analyzing price movements and identifying key support and resistance levels on a chart. Support levels are price levels where buying pressure is expected to be strong enough to prevent the price from falling further, while resistance levels are price levels where selling pressure is expected to be strong enough to prevent the price from rising further.
By placing orders based on the S&R level, traders can attempt to enter the market at optimal levels and minimize potential losses. When the price approaches a support level, traders may choose to go long (buy) in anticipation of a bounce. On the other hand, when the price approaches a resistance level, traders may choose to go short (sell) in anticipation of a reversal.
The S&R level can be plotted on a chart using a horizontal line or a series of lines. These lines serve as reference points for traders, helping them identify potential trading opportunities and manage risk. When the price crosses above the S&R level, it may indicate a bullish signal, while a cross below the S&R level may indicate a bearish signal.
It is important to note that the S&R level is not a guarantee of future price movements. Market conditions can change quickly, and price may not always respect support and resistance levels. Therefore, traders should use the S&R level in conjunction with other technical indicators and analysis tools to make informed trading decisions.
| Support Levels | Resistance Levels |
|---|---|
| Price levels where buying pressure is expected to be strong enough to prevent the price from falling further. | Price levels where selling pressure is expected to be strong enough to prevent the price from rising further. |
Read Also: Exploring the Role of the Chinese Yuan in Forex Trading
In technical analysis, the identification and analysis of support and resistance (S& R) levels play a crucial role in predicting future price movements in financial markets. These levels are points on a price chart where the price tends to find support (in the case of a support level) or encounter resistance (in the case of a resistance level).
Support levels are price levels where buying pressure outweighs selling pressure, causing the price to reverse its downward trend and potentially start moving upwards. Traders and investors often use support levels as potential entry points for long positions or as levels to place stop-loss orders for existing positions. Support levels can be identified by looking at historical price data and observing areas where the price has reversed its decline multiple times in the past.
Resistance levels, on the other hand, are price levels where selling pressure outweighs buying pressure, causing the price to reverse its upward trend and potentially start moving downwards. Traders and investors often use resistance levels as potential entry points for short positions or as levels to place take-profit orders for existing positions. Resistance levels can be identified by looking at historical price data and observing areas where the price has reversed its ascent multiple times in the past.
By paying attention to S& R levels, traders and investors can make more informed decisions about when to enter or exit trades, and where to place their stop-loss and take-profit orders. These levels act as psychological barriers that influence market participants’ behavior and can often lead to price reversals or consolidations.

| Support Levels | Resistance Levels |
|---|---|
| Points on a price chart where buying pressure outweighs selling pressure | Points on a price chart where selling pressure outweighs buying pressure |
| Potential entry points for long positions | Potential entry points for short positions |
| Levels to place stop-loss orders for existing positions | Levels to place take-profit orders for existing positions |
| Identified by looking at historical price data and observing areas of price reversal | Identified by looking at historical price data and observing areas of price reversal |
In conclusion, the role of S& R levels in technical analysis is essential for traders and investors to identify potential entry and exit points, as well as to manage risk by placing appropriate stop-loss and take-profit orders. These levels act as important psychological barriers that can influence price movements in financial markets.
The term S& R level stands for Support and Resistance level. It refers to price levels on a chart where there is a significant amount of buying or selling pressure, causing the price to either stall or reverse.
Support and resistance levels are determined by analyzing historical price data. Traders identify areas where the price has previously reversed or stalled multiple times and consider those levels as potential support or resistance areas.
Support and resistance levels are important for traders because they provide valuable information about the potential future price movements. Traders use these levels to make decisions about entering or exiting trades, setting stop-loss and take-profit levels, and identifying potential price targets.
Yes, support and resistance levels can be breached. When a support or resistance level is breached, it indicates a potential change in the market sentiment and often leads to a continuation of the price movement in the direction of the breach.

Cost of VPS for forex trading Forex trading has gained immense popularity in recent years, attracting traders from all walks of life. Whether you are …
Read Article
What Happened to 5Linx? 5Linx, once a prominent player in the multi-level marketing industry, has faced a series of setbacks that have led to its …
Read Article
Responsibilities of a Treasury Analyst: What Do They Do? A treasury analyst is a financial professional responsible for managing and analyzing an …
Read Article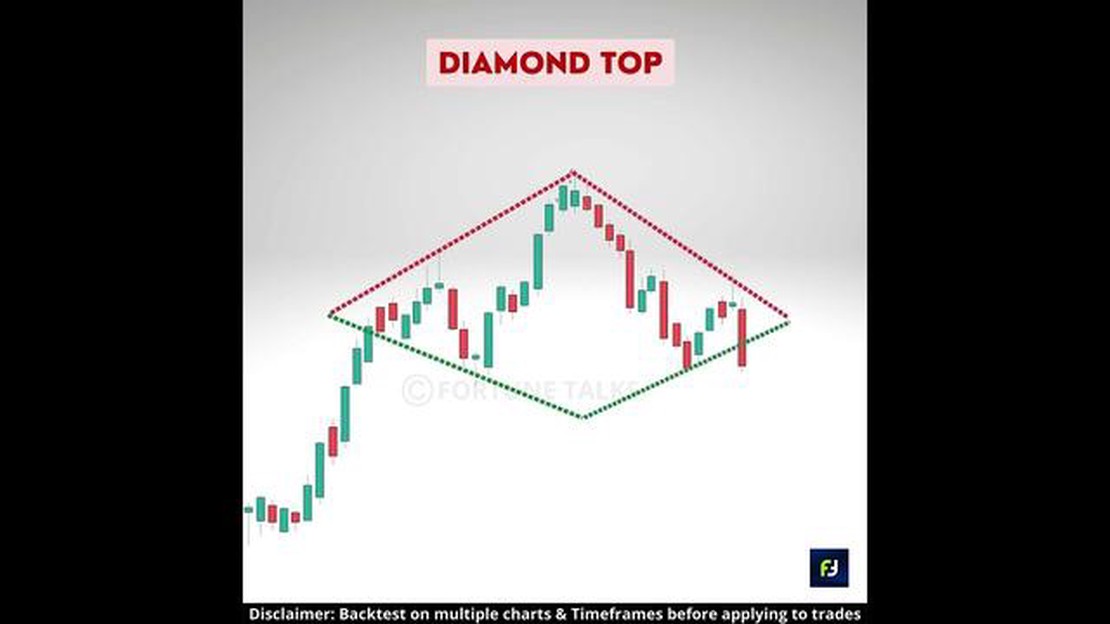
Understanding the Bearish Nature of the Diamond Pattern Diamond chart patterns are a classic technical analysis tool that can provide valuable …
Read Article
Exponentially Weighted Moving Average Charts for Monitoring the Process Mean Process mean monitoring is an essential step in ensuring the quality and …
Read Article
Will the Vietnamese Dong rise in value? The Vietnamese Dong, the official currency of Vietnam, has been a subject of speculation in recent years …
Read Article


