


The RIM and SEC Controversy: Examining the Issue
The Issue with RIM and SEC: Explained In recent years, the relationship between the Research In Motion (RIM) and the Securities and Exchange …
Read Article
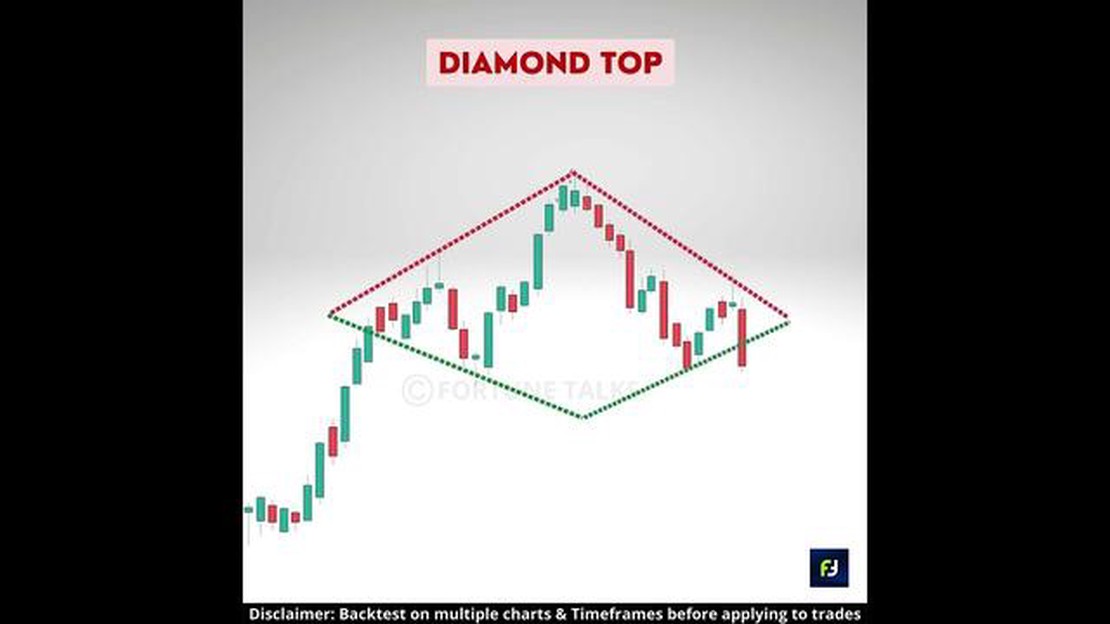
Diamond chart patterns are a classic technical analysis tool that can provide valuable insights into the future direction of a stock or other financial instrument. These patterns get their name from their shape, which resembles a diamond. The diamond pattern is created when the price of an asset forms a series of higher highs and lower lows, eventually leading to a consolidation phase.
During this consolidation phase, the price forms a symmetrical triangle, with the highs forming one trendline and the lows forming another trendline. These trendlines converge toward each other until they intersect, forming the diamond shape. This pattern is often seen as a reversal pattern, signaling a potential shift in the current trend.
When a diamond pattern is identified, traders look for specific confirmation signals to determine the likelihood of a bearish move. These signals may include a breakdown below the lower trendline, a decrease in trading volume, or a bearish reversal pattern, such as a shooting star candlestick formation. Traders may also analyze other technical indicators, such as moving averages or oscillators, to further validate the bearish signal.
It is important to note that diamond patterns, like any other technical analysis tool, are not foolproof. The market is unpredictable, and there can always be false signals. Traders should use diamond patterns in conjunction with other forms of analysis and risk management techniques to make informed trading decisions. Additionally, it is crucial to keep an eye on other factors, such as news events or economic indicators, that can impact the market and override the signals provided by the diamond pattern.
A diamond pattern is a technical analysis chart pattern that occurs when there is a contraction in price range followed by a symmetrical triangle pattern. It is considered a reversal pattern, which means that it can signal a trend reversal from bullish to bearish.
When a diamond pattern forms, it indicates indecision in the market as buyers and sellers struggle for control. This can lead to a period of consolidation, where the price range narrows as the pattern forms. Eventually, the price breaks out of the diamond pattern, confirming a new trend direction.

In general, a diamond pattern is considered bearish because it often occurs in a downtrend and signals a potential continuation of the bearish trend. The breakout from the pattern typically occurs to the downside, confirming the bearish bias. Traders and investors may interpret this as a signal to sell or take short positions.
It’s important to note that not all diamond patterns are bearish. Sometimes, a diamond pattern can form in an uptrend, indicating a potential trend reversal to the downside. In these cases, the breakout from the pattern would occur to the downside, confirming the bearish bias.
Traders and investors use various technical indicators and additional chart patterns to confirm the validity of the diamond pattern and to make more informed trading decisions. It is crucial to consider other factors such as volume, momentum, and trendlines to complement the analysis of the diamond pattern.
Read Also: Reasons for hedging to be illegal in the US: Understanding the regulations and implications
Overall, a diamond pattern is a bearish chart pattern that can signal a potential trend reversal from bullish to bearish. However, it is important to consider additional technical analysis tools to confirm the pattern and make more accurate trading decisions.
Diamond chart patterns are a unique and distinct formation that can appear on price charts in technical analysis. These patterns are considered reversal patterns, indicating a potential change in the current trend.
A diamond pattern is formed when the price action creates a series of higher highs and lower lows, creating a narrowing range over time. This narrowing range is characterized by two trendlines, one sloping upwards and the other sloping downwards, converging towards a point at the right end of the pattern.
As the price continues to oscillate within this narrowing range, it forms the shape of a diamond. This pattern typically forms after a significant uptrend or downtrend, indicating a period of consolidation or indecision in the market.
Read Also: Official Exchange Rates: Where to Find Them
Identification of a diamond pattern is essential for technical analysts as it provides valuable insights into potential future price movements. Traders look for specific criteria to confirm the presence of a diamond pattern:
Interpretation of a diamond pattern can provide traders with potential trading opportunities. The diamond pattern is considered bearish or bullish depending on the prevailing trend. A diamond pattern forming after an uptrend is considered a bearish signal, indicating a potential trend reversal and a resumption of the downward movement. On the other hand, a diamond pattern forming after a downtrend is seen as a bullish signal, suggesting a potential trend reversal and an upward movement.
Important points to consider with diamond patterns:

In conclusion, diamond chart patterns in technical analysis provide traders with valuable insights into potential trend reversals and future price movements. By correctly identifying and interpreting these patterns, traders can make informed trading decisions and potentially profit from market movements.
A diamond pattern in technical analysis is a type of chart pattern that occurs when there is a contraction in price volatility. It is characterized by a series of higher highs and lower lows, forming a shape reminiscent of a diamond.
A diamond pattern is formed when there is a period of indecision in the market, causing price to fluctuate within a narrowing range. This can be seen as a series of higher highs and lower lows, forming the shape of a diamond on a price chart.
A diamond pattern can be either bearish or bullish, depending on its placement within a prevailing trend. If the diamond pattern forms after an uptrend, it is considered bearish and can indicate a potential trend reversal. Conversely, if it forms after a downtrend, it is considered bullish and can indicate a potential trend reversal to the upside.
A trader can use the diamond pattern to make trading decisions by looking for confirmation signals. If the diamond pattern forms after a strong uptrend, a trader may look for a break below the lower trendline as a signal to sell or take a short position. If the diamond pattern forms after a strong downtrend, a break above the upper trendline may be seen as a signal to buy or take a long position. Additionally, traders can use other technical indicators or chart patterns to confirm the signals provided by the diamond pattern.

The Issue with RIM and SEC: Explained In recent years, the relationship between the Research In Motion (RIM) and the Securities and Exchange …
Read Article
Forex Market Overview: Where is it Located? Trading on the foreign exchange market, commonly known as Forex, has become increasingly popular in recent …
Read Article
Can NRI purchase foreign exchange in India? Foreign exchange, also known as forex, plays a crucial role in international trade and investment. It …
Read Article
Convert $1000 Singapore to peso: current exchange rate Welcome to our currency conversion guide! If you’re wondering how much $1000 Singapore is in …
Read Article
Is AmiBroker compatible with Python? AmiBroker is a popular technical analysis software that allows traders and investors to create, test, and …
Read Article
What is the Tokyo Stock Exchange called? The Tokyo Stock Exchange is the primary stock exchange in Japan, and it is known as TSE. It serves as a …
Read Article


