


ETF for Euro Currency: Your Guide to Euro ETFs
ETF for Euro Currency: Everything You Need to Know If you are interested in investing in the euro currency, one option you have is to invest in euro …
Read Article
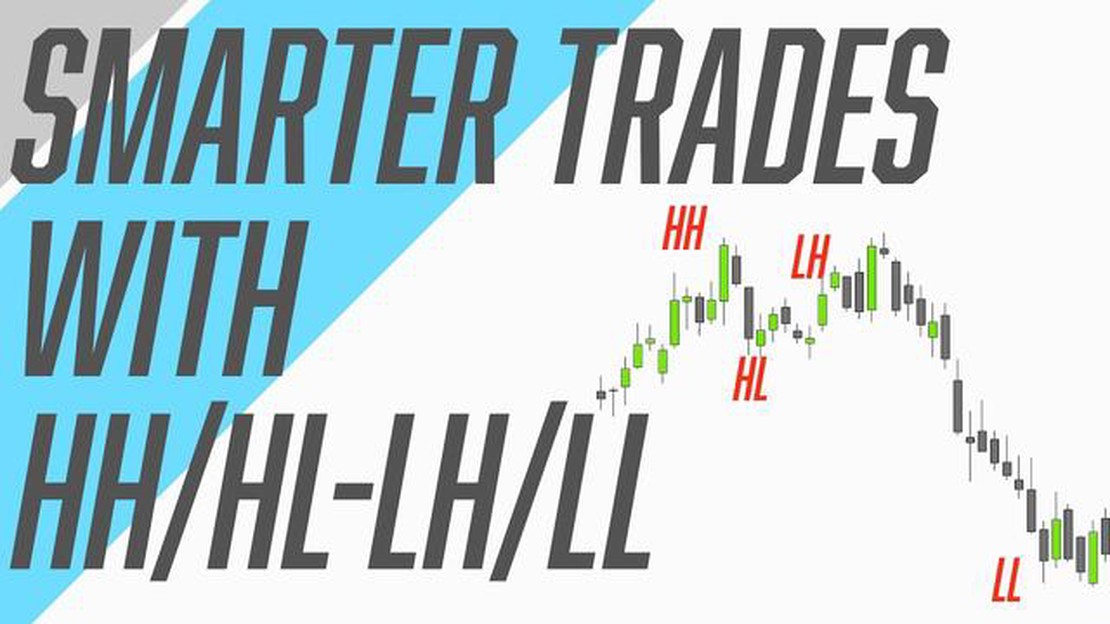
In the world of finance, there are numerous terms and abbreviations that can seem confusing to those who are new to trading. One such term is LH, which stands for “Lower High.” Understanding the concept of LH is essential for traders as it can help them identify potential trends and make informed decisions.
So, what exactly does LH mean? In simple terms, it refers to a price level in an asset’s chart that is lower than the previous high. In technical analysis, LH is often seen as a sign of a possible trend reversal or a weakening of the current trend. Traders use LH as a key indicator to determine when to enter or exit a trade.
When an asset forms a LH, it suggests that buyers are losing momentum, and the sellers may start gaining control. This can lead to a downward price movement or a change in the overall trend. Traders analyze LH in combination with other indicators and patterns to confirm their trading decisions.
It’s important to note that LH is not the only factor to consider when trading. Traders also look at other aspects such as support and resistance levels, volume, and market sentiment. By taking these factors into account, traders can develop a more comprehensive understanding of the market and improve their trading strategies.
In summary, LH stands for Lower High and is a term used in trading to describe a price level that is lower than the previous high. Traders use LH to identify possible trend reversals or weakening trends. It is essential to consider LH in conjunction with other indicators and patterns to make well-informed trading decisions. By understanding LH, traders can navigate the financial markets more effectively and improve their chances of success.
LH stands for “Lower High” and is a technical analysis concept in trading. It refers to a point on a chart where the price of an asset reaches a lower high compared to the previous high, indicating a potential reversal or change in trend.
The significance of LH lies in its ability to identify potential turning points in the market. When an asset forms a LH, it suggests that the buyers are losing momentum and the sellers are gaining control. It could be a sign that the upward trend is coming to an end, and a downtrend may begin.
Traders use LH as a part of their analysis to determine entry and exit points for trades. By spotting LH formations, they can identify potential areas of resistance and plan their trades accordingly.

It is important to note that LH is just one piece of the puzzle and should be used in conjunction with other technical indicators and analysis techniques. Traders often look for confirmation from other chart patterns, volume indicators, and trendlines before making trading decisions based on LH.
The LH concept is widely used across different financial markets, including stocks, forex, commodities, and cryptocurrencies. Traders rely on LH formations to help them make informed decisions, manage risk, and improve their trading strategies.
The concept of LH, or lower high, plays a crucial role in financial markets. It refers to a situation where the high point of an asset’s price is lower than the previous high point. This is often seen as a bearish signal, indicating a potential reversal or a downtrend in the market.
Read Also: Where Was Smoke Signals Made? Discover The Filming Locations
LH is closely related to the concept of lower highs and lower lows (LHLL), which is a key characteristic of a downtrend. When LHs are formed, it suggests that sellers are gaining strength and prices are unable to make new higher highs. This can be an indication that buyers are losing momentum and that a shift in market sentiment is occurring.
Traders and investors use LHs as a technical analysis tool to identify potential trend reversals and to make informed trading decisions. By identifying LHs, traders can anticipate potential entry and exit points, set stop-loss levels, and manage risk.
Furthermore, LHs can be used in conjunction with other technical indicators and chart patterns to validate trading signals. For example, if a LH is formed near a resistance level or in combination with bearish candlestick patterns, it may increase the likelihood of a trend reversal.
It is important to note that LHs should be analyzed in the context of the overall market conditions and other technical factors. Traders should consider other indicators, such as moving averages, volume, and support and resistance levels, to confirm the validity of LHs and to avoid false signals.
In summary, LHs are a valuable tool for traders and investors in financial markets. They provide important insights into market trends, potential reversals, and can help in making informed trading decisions. By incorporating LH analysis into their trading strategies, market participants can enhance their chances of success and reduce the impact of market volatility.
Identifying and trading LH (lower highs) can be a profitable strategy in the financial markets. Here are a few strategies that traders often use to identify and trade LH:
Read Also: FTSE MIB Index Country: Know the Country of FTSE MIB Index
 4. Oscillators: Traders can use oscillators like the Relative Strength Index (RSI) or the Stochastic Oscillator to identify LH. These indicators measure the momentum of a price movement. When the indicator reaches overbought levels and starts to decline, it could indicate a LH pattern. Traders can enter a short position when the indicator confirms the LH signal.
Remember that LH is just one pattern in the financial markets, and it should be used in conjunction with other technical analysis tools to make informed trading decisions. It is essential to consider other factors like overall market trends, support and resistance levels, and risk management when employing LH strategies.
LH stands for Lower High. In trading, LH refers to a pattern where the price of an asset creates a high point that is lower than the previous high point.
LH and HH are opposite patterns in trading. While LH represents a lower high, HH represents a higher high. LH indicates a potential reversal or a shift in trend, while HH suggests a continuation of the current trend.
LH is important in financial markets because it can indicate a shift in market sentiment. It suggests that buyers are becoming less willing to push the price higher, potentially leading to a reversal or a change in the trend.
Traders can identify LH by looking for a high point on a price chart that is lower than the previous high point. This can be done by drawing trendlines or using technical indicators that highlight highs and lows in the price data.
When traders spot LH in trading, it is important to closely monitor the price action and look for confirmation signals. Traders may consider taking a short position or tightening their stop-loss levels to protect profits. It is advisable to use other technical indicators or analysis methods to increase the probability of a successful trade.

ETF for Euro Currency: Everything You Need to Know If you are interested in investing in the euro currency, one option you have is to invest in euro …
Read Article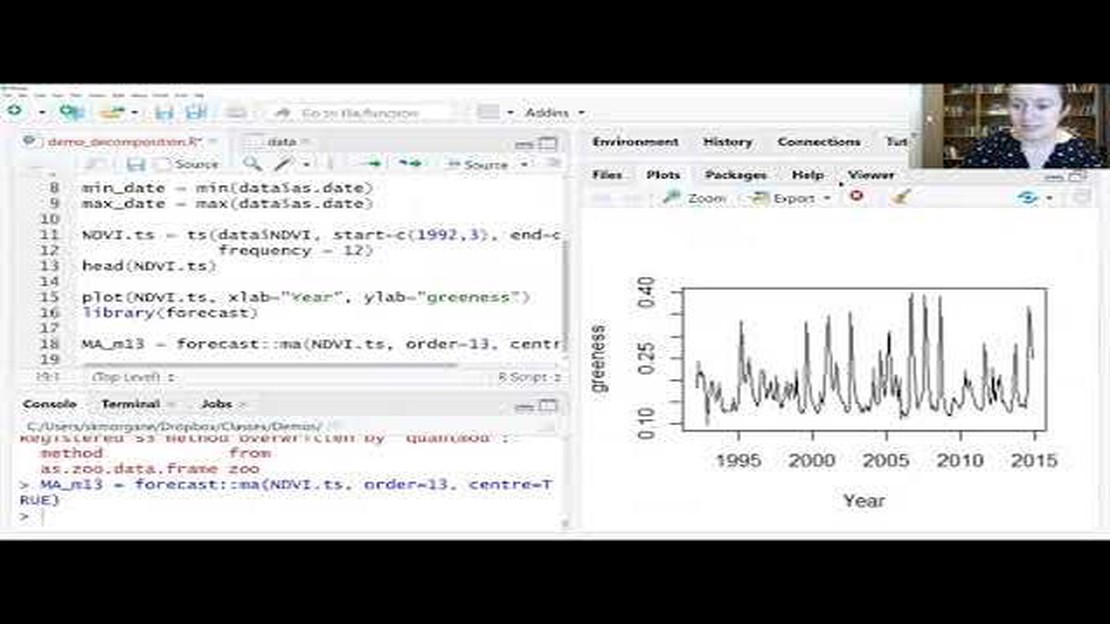
Understanding the SMA in R Package: an In-Depth Guide When it comes to analyzing time series data, the Simple Moving Average (SMA) is a widely used …
Read Article
Guide to Taxing Daytrading: Everything You Need to Know Day trading can be an exciting and profitable venture. However, when it comes to taxes, things …
Read Article
Understanding Reference Exchange Rates Maintaining stable exchange rates is crucial for the global economy, and reference exchange rates play a vital …
Read Article
What are the main functions of the forex market? Forex, short for foreign exchange, is the largest and most liquid financial market in the world. It …
Read Article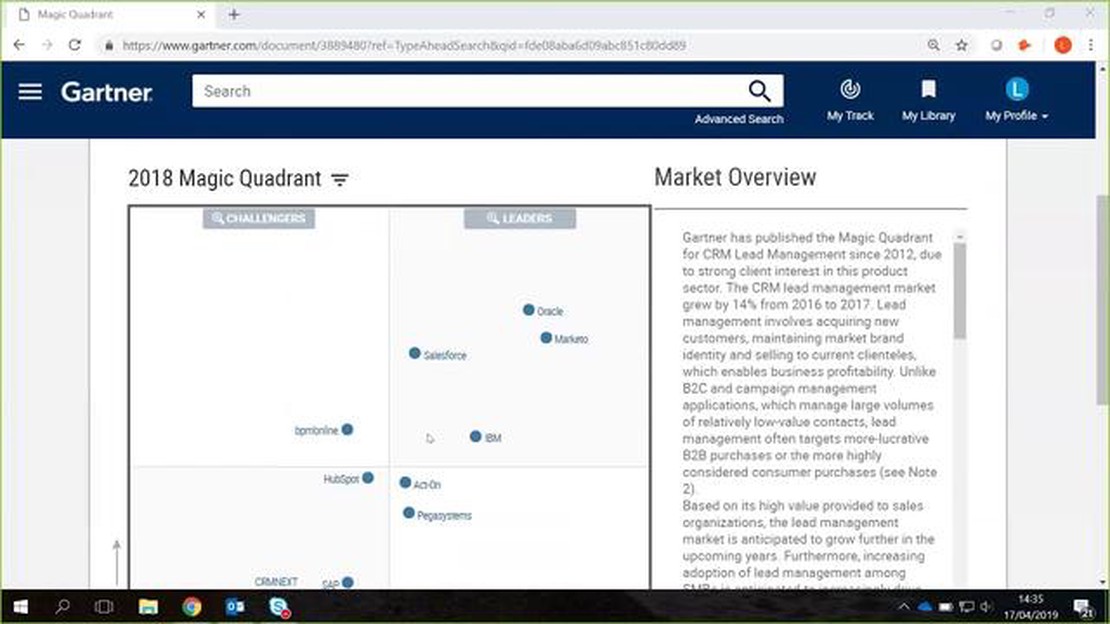
What is the Gartner Magic Quadrant used for? When it comes to evaluating and comparing technology solutions, Gartner Magic Quadrant is a widely …
Read Article


