


How to Withdraw Money from FXOpen: Step-by-Step Guide
Withdrawal Guide for FXOpen Account Holders Withdrawing money from your FXOpen account is a simple process that can be completed in just a few easy …
Read Article
When it comes to analyzing time series data, the Simple Moving Average (SMA) is a widely used statistical method. SMA can help us understand and predict trends in the data, making it an essential tool for many industries and fields. In this article, we will explore how to use the SMA function in the R programming language to analyze time series data and make informed decisions.
The SMA function in R allows us to calculate the average value of a specified window size over a given time period. By sliding this window along the time series data, we can obtain a moving average that smooths out the fluctuations and reveals the underlying trend. This is particularly useful when dealing with noisy or erratic data, where it might be difficult to spot trends or patterns with the naked eye.
In addition to providing a smoothed representation of the data, SMA can also be used for forecasting future values. By analyzing the historical data and the calculated moving averages, we can identify potential trends and make predictions about future values. This can be crucial for decision-making in financial markets, forecasting sales or demand, and many other applications where understanding patterns and trends is essential.
This guide will walk you through the process of using the SMA function in R, including how to specify the window size, deal with missing values, and interpret the results. We will also cover some best practices and considerations when using SMA for time series analysis. Whether you are a beginner or an experienced R user, this guide will provide you with the knowledge and tools to effectively leverage SMA for your time series analysis.
So, let’s dive into the world of SMA in R and unlock its potential for analyzing and predicting time series data.
SMA stands for Simple Moving Average and is a widely used technical analysis tool in the field of finance. It is a calculation that helps to analyze trends and patterns in time series data.
The SMA in the R package is a function that allows users to calculate the simple moving average for a given time series. The function takes a series of data points and a window size as input, and returns a new series of data points that represents the average over the specified window.
The simple moving average is calculated by taking the sum of the data points within the window and dividing it by the number of data points in the window. This average is then applied to each data point within the series to create a new series of moving averages.
The SMA can be used to identify trends and patterns in the data. When the SMA is rising, it indicates that the data points are generally increasing over time. Conversely, when the SMA is falling, it suggests that the data points are decreasing.
The SMA is often used in combination with other technical analysis tools and indicators to make informed trading decisions. For example, traders may use the SMA to identify potential buy or sell signals based on the crossover of different moving averages.

Overall, the SMA in the R package is a valuable tool for analyzing time series data and can provide insights into the trends and patterns within the data.
The Simple Moving Average (SMA) is a commonly used method for trend analysis in time series data. It helps in smoothing out the noise and identifying the underlying trend. In the R package, SMA is implemented as a function that can be applied to a time series data to calculate the moving average.
To use the SMA function, you need to have a time series data in the form of a numeric vector or a data frame with a column of numeric values representing the observations over time. You also need to specify the window size, which determines the number of observations used for calculating the moving average.
The SMA function calculates the moving average by taking the average of the specified number of previous observations at each point in the time series. It then returns a new vector or data frame with the moving average values for each observation. The function considers the first “n” observations, where “n” is the window size, as “NA” values by default, as there are not enough previous observations to calculate the average.
Read Also: Step-by-Step Guide: How to Enter Option Trades
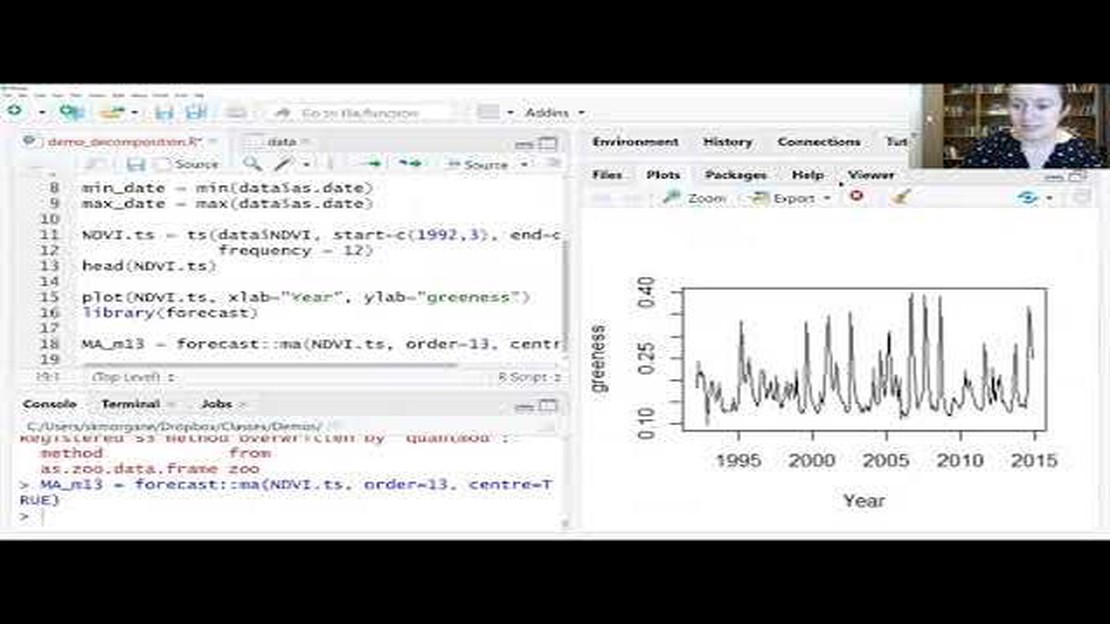
Here is an example of how to use the SMA function:
# Load the required libraries
library(TTR)
# Create a time series data
data <- c(10, 15, 20, 25, 30, 35, 40)
# Calculate the SMA with window size 3
Read Also: Understanding the Candle Body Size Indicator in MT5: A Comprehensive Guide
sma <- SMA(data, n = 3)
The resulting SMA vector will contain the moving average values for each observation in the original data:
[1] NA NA 15 20 25 30 35
As you can see, the first two observations in the SMA vector are “NA” because there are not enough previous observations to calculate the average. From the third observation onwards, the moving average values are computed based on the specified window size.

The SMA function in the R package provides a flexible and efficient way to calculate the moving average for time series data. By adjusting the window size, you can control the level of smoothing and adapt the function to your specific needs.
SMA stands for Simple Moving Average, which is a technique widely used in data analysis to identify trends and smooth out noise in time series data. There are other similar techniques in data analysis, such as Exponential Moving Average (EMA) and Weighted Moving Average (WMA).
SMA calculates the average of a specified number of previous data points in a time series. The window size determines the number of data points to include in the calculation. As new data points become available, the average is recalculated by dropping the oldest data point and including the newest data point.
SMA is easy to understand and implement, making it a popular choice for trend analysis. It can help identify the direction of the trend and potential entry or exit points in trading strategies. In addition, SMA can provide a smooth representation of the data by filtering out noise.
SMA can be applied to various types of data, including financial data, stock prices, sales data, and weather data. However, it is important to consider the characteristics of the data and whether SMA is suitable for the specific analysis or forecasting task.
One of the limitations of SMA is that it gives equal weight to all data points within the window, which may not be ideal for certain situations where recent data may be more relevant. SMA can also lag behind the actual trend due to its smoothing nature. Additionally, SMA is sensitive to outliers and can be affected by sudden changes in the data.
SMA stands for Simple Moving Average. It is a widely used technical analysis tool in the stock market to identify trends and signal potential buy or sell opportunities. In the R package, SMA can be computed using the SMA() function, which takes a time series of data as input and returns the moving average over a specified window.
SMA is primarily used to identify trends and signal potential buy or sell opportunities in the stock market. While it can provide insights into the historical data, it is not designed for forecasting future values. For forecasting, one might consider using other techniques such as exponential smoothing or ARIMA models.

Withdrawal Guide for FXOpen Account Holders Withdrawing money from your FXOpen account is a simple process that can be completed in just a few easy …
Read Article
What is the 90 Rule Forex? Forex trading can be a complex and daunting world to navigate. Traders are constantly bombarded with new strategies, …
Read Article
Are there any wealthy individuals in forex trading? Forex trading, also known as foreign exchange trading, has gained popularity in recent years as a …
Read Article
Understanding PMS in Trading: A Comprehensive Guide Trading in the financial markets requires a deep understanding of the various concepts and …
Read Article
Understanding the 4H: A Key Concept in Forex Trading When it comes to Forex trading, understanding the 4H chart is crucial. The 4H chart, also known …
Read Article
Is IQ Option Halal or Haram in Islam? When it comes to investing, many Muslims want to ensure that their financial activities are in line with the …
Read Article


