


Heat trades 2021: A complete list of players traded this year
Who did the Heat trade this year? The Miami Heat have been busy making moves during the 2021 NBA season, as they look to improve their roster and make …
Read Article
Moving average is a popular technical analysis tool used by traders to identify trends and make informed decisions. It smooths out price data over a specified time period, providing a clearer picture of the overall trend.
So, what exactly does moving average tell you? In simple terms, it helps to filter out the noise and focus on the underlying direction of the market. By calculating the average of a set of prices over a specific period, you can get a more reliable indicator of the trend’s direction.
But how does it work? Let’s say you’re looking at a 50-day moving average. This means that the average price over the past 50 days is calculated and plotted on a chart. As each new day’s data is added, the oldest data point is dropped, and the average is recalculated. This creates a moving line that represents the average price over time.
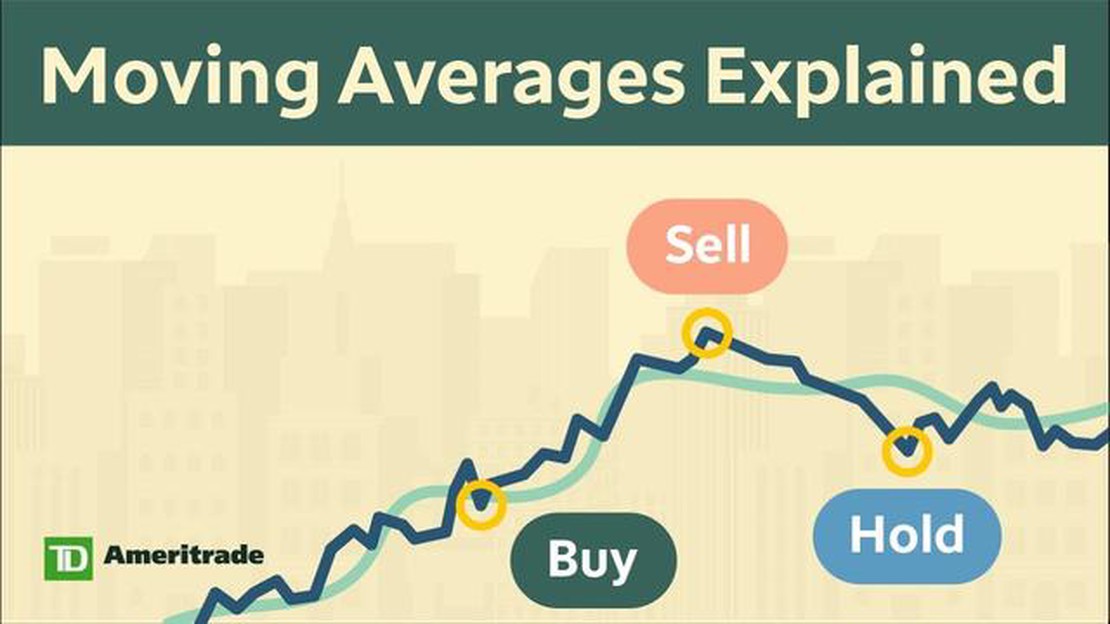
By looking at the slope and positioning of the moving average line, traders can obtain valuable insights about the market. If the moving average is sloping upwards, it suggests an uptrend, while a downwards slope indicates a downtrend. Traders can use this information to identify potential entry or exit points.
Moving average is a versatile tool that can be used on any timeframe and is suitable for various trading strategies. It can be used to confirm trend reversals, determine support and resistance levels, and generate trading signals.
Overall, moving average is a simple yet powerful tool that can provide valuable information about the direction and strength of a market trend. By understanding how it works and interpreting its signals, traders can make more informed trading decisions and potentially improve their profitability.
The moving average is a commonly used statistical tool that can help investors and traders analyze price trends and make informed decisions. The moving average calculates the average price of a security over a specified period of time and is commonly used in technical analysis.
The moving average can provide several important insights:
| Insight | Description |
|---|---|
| Trend Identification | The moving average can help identify the direction of the current trend. If the price is consistently trading above the moving average, it indicates an uptrend. Conversely, if the price is consistently trading below the moving average, it indicates a downtrend. |
| Support and Resistance Levels | The moving average can act as a support or resistance level for the price. If the price approaches the moving average and bounces off, it indicates a support level. Conversely, if the price approaches the moving average and struggles to break through, it indicates a resistance level. |
| Price Reversals | The moving average can help identify potential price reversals. If the price has been trending in one direction and then crosses above or below the moving average, it may signal a potential reversal. |
| Price Momentum | The moving average can help measure the momentum of the price. If the price is consistently trading above the moving average and the moving average is sloping upwards, it indicates positive momentum. Conversely, if the price is consistently trading below the moving average and the moving average is sloping downwards, it indicates negative momentum. |
Overall, the moving average is a versatile tool that can provide valuable insights into price trends and market dynamics. By understanding what the moving average tells you, investors and traders can make more informed decisions and potentially improve their trading strategies.

A moving average is a calculation used to analyze data points by creating a series of averages of different subsets of the full data set. It is commonly used in finance, economics, and statistics to help smooth out the fluctuations and identify trends in data.
Read Also: How Much Do You Lose on Option Trading? - Understanding the Risks
The moving average is calculated by taking the average of a set number of data points over a specific time period. For example, to calculate a 10-day moving average, you would add up the closing prices of the past 10 days and divide by 10. The result is a single value that represents the average price over that 10-day period.
This calculation is then repeated for each subsequent period, using the most recent data points. This creates a series of moving averages that can be plotted on a chart to visualize the overall trend. By smoothing out the daily fluctuations, the moving average helps to reveal the underlying pattern or direction of the data.
Moving averages can be used to analyze various types of data, such as stock prices, sales figures, and temperature readings. They can be calculated for different time periods, ranging from a few days to several months or even years, depending on the desired level of analysis.
Traders and investors often use moving averages to identify buying or selling opportunities. When the price of an asset is above its moving average, it is considered bullish or positive, indicating that the trend is upward. Conversely, when the price is below its moving average, it is considered bearish or negative, indicating a downward trend.
While moving averages can be a useful tool for analyzing data and identifying trends, it is important to note that they are based on historical data and may not accurately predict future movements. Therefore, they should be used in conjunction with other indicators and analysis methods to make informed decisions.
Calculating a moving average involves taking the average of a certain number of data points over a specified period of time. The period over which the moving average is calculated is generally referred to as the “window”. A smaller window will result in a more responsive moving average, while a larger window will create a smoother average.
| Day | Price | Moving Average (3-day) |
|---|---|---|
| 1 | 10 | |
| 2 | 12 | |
| 3 | 15 | 12.33 |
| 4 | 14 | 13.67 |
| 5 | 13 | 14 |
For example, let’s say we want to calculate a 3-day moving average for a stock price. We start by taking the sum of the prices for the first 3 days and dividing it by 3 to get the average. We then move forward one day and drop the first day’s price, add the new day’s price, and again divide by 3. This process is repeated for each subsequent day, resulting in a moving average that reflects the overall trend over the specified time period.
Read Also: Trade Confirmation: How to Get It and Why It's Important
As demonstrated in the table above, on the third day, the moving average is calculated by taking the sum of the prices for days 1, 2, and 3 (10 + 12 + 15 = 37) and dividing by 3 (37 ÷ 3 = 12.33). On the fourth day, the moving average is calculated by taking the sum of the prices for days 2, 3, and 4 (12 + 15 + 14 = 41) and dividing by 3 (41 ÷ 3 = 13.67). This process continues for each subsequent day, resulting in a moving average that provides a smoothed representation of the stock price.

By using moving averages, investors and traders can identify potential trends and patterns in a stock’s price movement. They can also help filter out short-term fluctuations and provide a clearer view of the overall market direction. Whether it’s a simple moving average or an exponential moving average, understanding how they are calculated is essential for utilizing them effectively in technical analysis.
A moving average is a statistical calculation used to analyze data points by creating a series of averages of different subsets of the full data set.
A moving average indicates the overall trend in the data set by reducing the effects of short-term fluctuations or noise.
A moving average is calculated by adding up a specific number of data points and then dividing the sum by that specific number. This process is repeated as the data set moves forward in time.
Using a moving average helps to smoothen out the data and make it easier to interpret by providing a clearer picture of the overall trend.
A moving average is considered useful in identifying long-term trends and confirming potential trend reversals.
A moving average is a calculation used to analyze data points by creating a series of averages of different subsets of the full data set.
Moving averages are used in technical analysis to help identify trends and provide insight into the overall direction of a market or security.

Who did the Heat trade this year? The Miami Heat have been busy making moves during the 2021 NBA season, as they look to improve their roster and make …
Read Article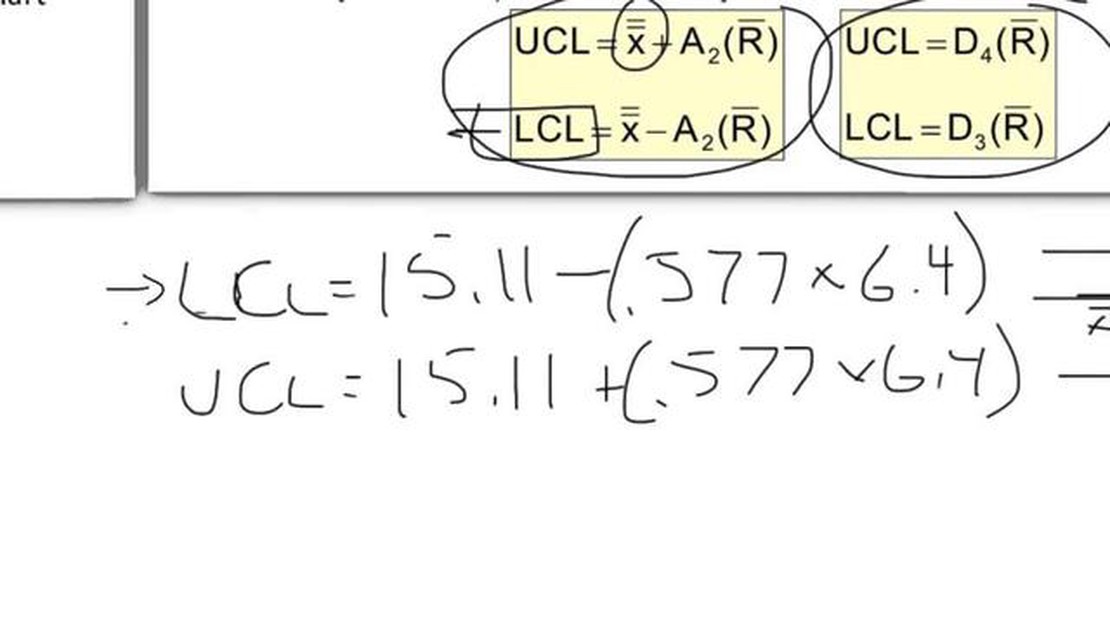
What is the upper control limit? When it comes to statistical process control (SPC), the upper control limit (UCL) plays a crucial role in monitoring …
Read Article
Does Moving Average Crossover Really Work? Trading strategies are essential for investors to maximize their returns and minimize their risks in the …
Read Article
EUR USD OTC prediction: What to Expect Welcome to our article on the EUR USD OTC prediction! Whether you are an experienced investor or someone just …
Read Article
Understanding the Volatility Breakout Strategy Volatility breakout strategy is a popular trading approach that aims to take advantage of significant …
Read Article
What to Include in a Disclaimer When creating content for websites, it is essential to include a disclaimer to protect yourself and your readers from …
Read Article


