


Understanding the 5 inputs of the Black-Scholes model: A comprehensive guide
Understanding the 5 Inputs of the Black-Scholes Model The Black-Scholes model, developed by economists Fischer Black and Myron Scholes in 1973, is a …
Read Article
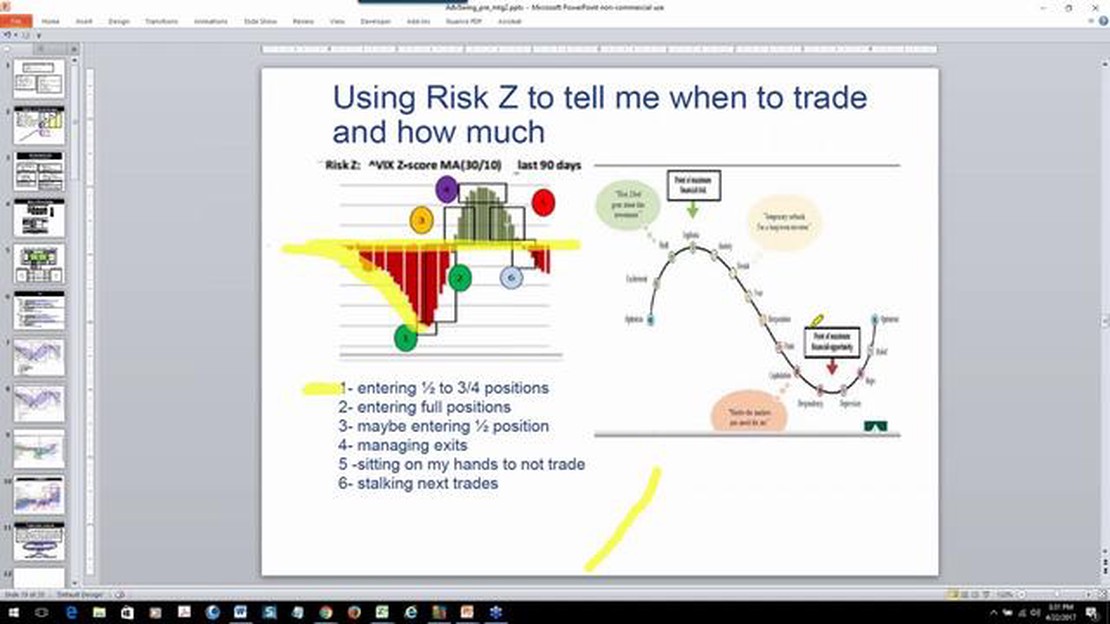
When it comes to trading in the financial markets, understanding and analyzing data is crucial for making informed decisions. One of the key tools used by traders is the Z-Score, which helps in identifying deviations from the norm and assessing the likelihood of future occurrences.
The Z-Score is a statistical measure that quantifies how far a particular data point is from the mean, in terms of standard deviations. It can be used to identify outliers or extreme data points that might indicate a potential market anomaly or abnormal behavior. This measure is particularly useful in trading, where spotting and analyzing anomalies can provide valuable insights and potentially lead to profitable opportunities.
To calculate the Z-Score, you need to have a dataset representing the variable you want to analyze and its historical distribution. By subtracting the mean from each data point and dividing it by the standard deviation, you can determine how many standard deviations each point is away from the mean. A positive Z-Score indicates that the data point is above the mean, while a negative Z-Score indicates that it is below the mean.
Traders use Z-Scores to develop trading strategies based on mean reversion or trend following. Mean reversion strategies involve taking positions when the Z-Score indicates that the price has deviated from its mean and is likely to converge back towards it. On the other hand, trend following strategies involve taking positions when the Z-Score indicates that the price is trending in a certain direction and is likely to continue doing so.
The Z-score is a statistical measure that is used in trading to understand the relationship between a data point and the mean of a group of data points. It helps in determining how far away a particular data point is from the mean, in terms of the standard deviation of the data. The Z-score is expressed in terms of standard deviations from the mean.
The formula to calculate the Z-score is:
Z = (X – μ) / σ
Where:
By calculating the Z-score, traders can compare different data points from different datasets. It provides a standardized way of measuring how different a particular data point is from the mean, regardless of the scale or units of the original data. This allows traders to compare the relative positions of data points and make more informed trading decisions.

The z-score is a statistical measurement that represents the number of standard deviations away from the mean a particular data point is. It is commonly used in trading to assess the likelihood of a stock or market returning to its mean value.
A lower z-score indicates that a data point is closer to the mean and has a higher probability of occurring, while a higher z-score indicates that a data point is farther away from the mean and has a lower probability of occurring.
Read Also: Benefits of using the Horizon system for your business
When interpreting z-score values in trading, there are a few key points to consider:
1. Positive Z-Score
A positive z-score indicates that the data point is above the mean and has a higher value than the average. This suggests that the stock or market is performing better than expected and is potentially overvalued. Traders may consider selling or taking profits in this situation.
2. Negative Z-Score
A negative z-score indicates that the data point is below the mean and has a lower value than the average. This suggests that the stock or market is performing worse than expected and is potentially undervalued. Traders may consider buying or holding onto the asset in anticipation of it returning to its mean value.
3. Extreme Z-Score
A z-score with an absolute value greater than 3 indicates an extreme outlier. This means that the data point is significantly different from the mean and may indicate an abnormal event or market condition. Traders should exercise caution when dealing with extreme z-scores as they may be an indication of a potential anomaly or market disruption.
Overall, the z-score provides traders with a valuable tool for assessing the relative position of a data point within a distribution. By understanding the interpretation of z-score values, traders can make more informed decisions and manage their risks effectively.
Read Also: Find Out the Cost of Cardstock Paper at Fedex
The Z-Score is a statistical tool that measures the relationship between the mean and standard deviation of a set of data. In the context of trading, it is used to calculate the probability of extreme events occurring in a financial market.
Traders use the Z-Score to identify potential trading opportunities and to assess the risk associated with those opportunities. By calculating the Z-Score of a particular asset or trading strategy, traders can determine whether the returns of that asset or strategy are within the expected range or are considered abnormal.

One common trading strategy that uses the Z-Score is mean reversion. Mean reversion strategies exploit the tendency of prices to revert to their mean or average level after deviating from it. Traders can use the Z-Score to identify when an asset’s price has deviated significantly from its mean and may be due for a reversal.
Another way the Z-Score is used in trading strategies is to assess the probability of extreme price movements. Traders can use the Z-Score to calculate the likelihood of a price move exceeding a certain threshold, such as a 1, 2, or 3 standard deviation move. This information can be used to adjust risk management strategies and set appropriate stop-loss levels.
Additionally, the Z-Score can be used to compare the performance of different trading strategies. By calculating the Z-Score for each strategy, traders can determine which strategy is providing the most consistent and stable returns. This information can help traders make informed decisions about which strategies to allocate their capital to.
In summary, the Z-Score is a valuable tool in trading strategies as it allows traders to assess the risk and probability of extreme events in financial markets. By using the Z-Score, traders can identify potential trading opportunities, adjust risk management strategies, and compare the performance of different trading strategies.
A Z-Score is a statistical measurement that describes a value’s relationship to the mean of a group of values. In trading, it is used to determine the probability of a trade being profitable based on past performance. By comparing the current performance of a trade to the historical performance of similar trades, traders can make informed decisions about whether to enter or exit a position.
The formula for calculating the Z-Score is (X - μ) / σ, where X is the value being standardized, μ is the mean of the group, and σ is the standard deviation of the group. This formula calculates how many standard deviations away from the mean the value is, allowing for comparison across different datasets.
The Z-Score helps in identifying overbought and oversold conditions in trading by measuring how much a value deviates from its mean in terms of standard deviations. A high Z-Score indicates that the value is overbought, meaning it is trading at a level significantly above its mean, and may be due for a downward correction. Conversely, a low Z-Score indicates that the value is oversold, meaning it is trading at a level significantly below its mean, and may be due for an upward correction.
While the Z-Score is a useful tool in trading, there are limitations and drawbacks to consider. One limitation is that it assumes a normal distribution of data, which may not always be the case in financial markets. Additionally, the Z-Score relies on historical data, so it may not accurately capture sudden changes or market events. Traders should also be cautious of relying solely on the Z-Score and consider other technical and fundamental factors in their decision-making process.

Understanding the 5 Inputs of the Black-Scholes Model The Black-Scholes model, developed by economists Fischer Black and Myron Scholes in 1973, is a …
Read Article
Which type of trading is most profitable in India? Are you interested in trading in India? If so, you may be wondering what type of trading is the …
Read Article
How to Bulk Price in Poe Path of Exile is a popular multiplayer online action role-playing game developed and published by Grinding Gear Games. The …
Read Article
Current USD to NZD Exchange Rate If you are planning a trip to New Zealand or involved in any business transactions with the country, knowing the …
Read Article
Employee Benefits of Cisco Cisco is a global technology leader that provides networking solutions to businesses and organizations across the world. …
Read Article
Brokers with Competitive Spreads: Which One to Choose? When it comes to trading in the financial markets, one of the most important factors to …
Read Article


