
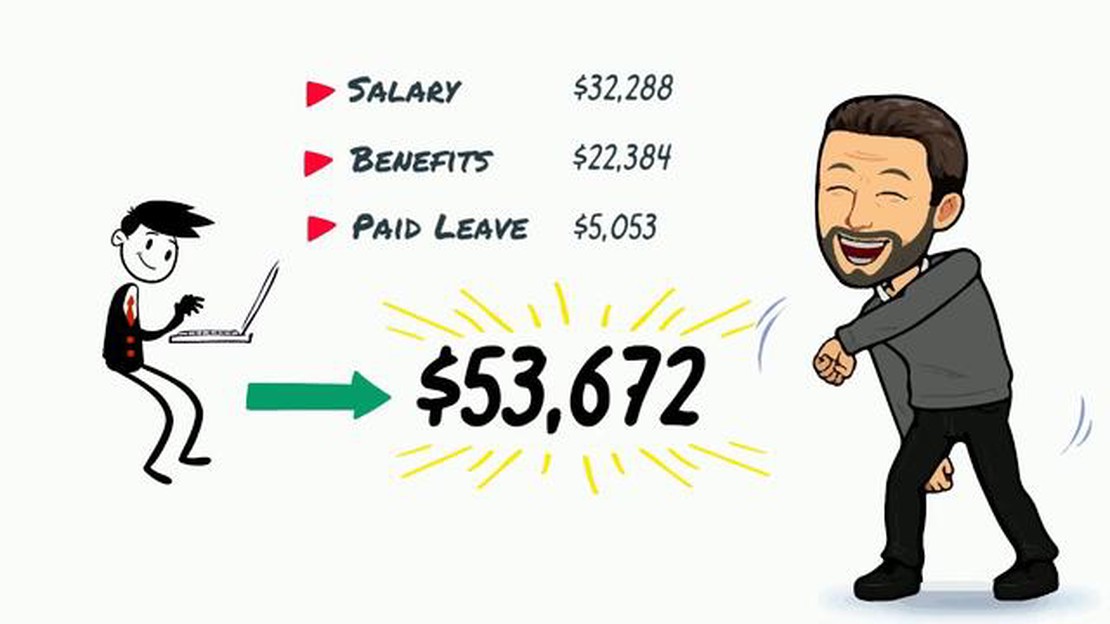

Reasonable Compensation Package: Factors to Consider and How to Negotiate
What is a reasonable compensation package? When considering a new job or negotiating a raise, one of the most important factors to consider is the …
Read Article
When it comes to forex trading, understanding common candlestick patterns is essential for successful analysis and decision-making. One such pattern that is often observed is the Tweezer Top pattern. This pattern can provide traders with valuable insights into potential market reversals, allowing them to make informed trading decisions.
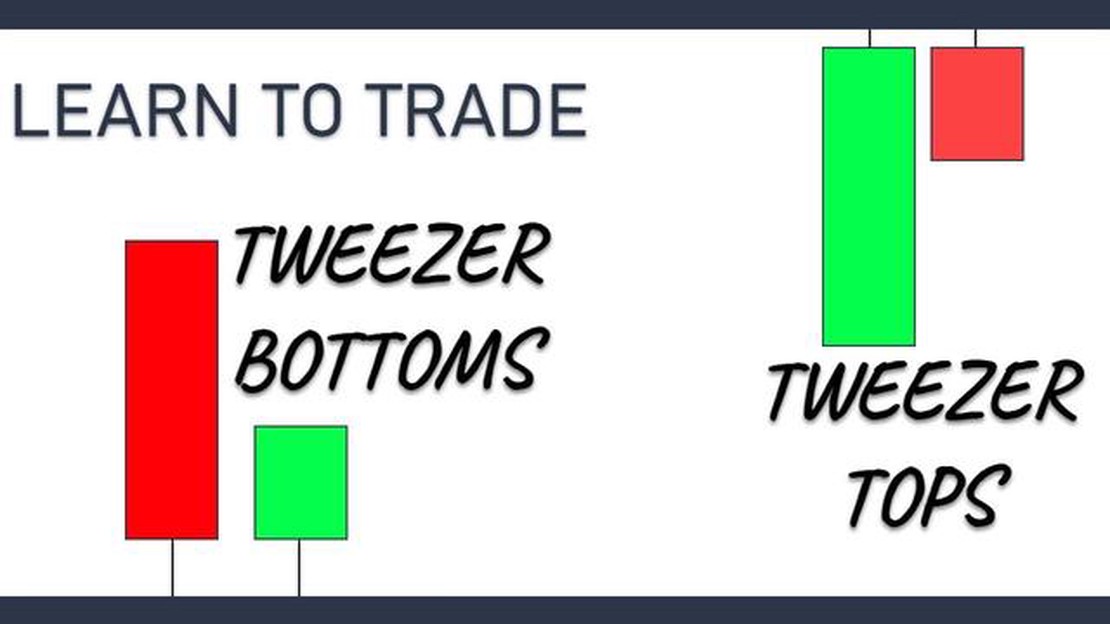
The Tweezer Top pattern is characterized by two candlesticks with similar highs, forming a horizontal line at the top of the pattern. The first candlestick is bullish, indicating an upward trend, while the second candlestick is bearish, suggesting a potential reversal. This pattern is typically seen at the end of an uptrend and can indicate that buyers are losing momentum and the market may soon turn bearish.
Traders look for the Tweezer Top pattern as it can present an opportunity to enter a short position and take advantage of a possible downtrend. However, it is important to note that this pattern should not be used as the sole basis for making trading decisions. It is always recommended to combine it with other technical indicators and analysis to get a more complete picture of the market.
By understanding and recognizing the Tweezer Top pattern, forex traders can add another tool to their arsenal for identifying potential reversals and making profitable trades. It is important to study and practice identifying this pattern in historical charts to build confidence and proficiency in recognizing it in real-time trading situations. This knowledge, combined with other technical analysis techniques, can help traders make more informed decisions and increase their chances of success in the forex market.
The Tweezer Top pattern is a popular chart pattern in Forex trading that can indicate a potential trend reversal. It is formed when two consecutive candlesticks have approximately equal highs, forming a horizontal line. The first candlestick is usually bullish, while the second candlestick is bearish.
The name “tweezer” comes from the similarity of the pattern to a pair of tweezers. The tweezer top pattern is considered a reversal pattern because it often occurs at the top of an uptrend, signaling that the bulls are losing control and the bears may start to take over.
To confirm the validity of the tweezer top pattern, traders often look for additional signals such as a bearish confirmation candlestick or a break below a support level. This can help to provide more confidence in the potential reversal.
Traders can use the tweezer top pattern as a signal to enter a short position, or to close out their long positions. It is important to always use proper risk management techniques and confirm the pattern with other technical indicators or analysis methods before making any trading decisions.
The tweezer top pattern is a candlestick pattern that indicates a potential reversal in a bullish trend. It consists of two consecutive candles with similar highs but different lows, forming a pattern that resembles a pair of tweezers.
To identify the tweezer top pattern, follow these steps:

When the tweezer top pattern is identified, it suggests that the buying pressure is weakening and the bears may take over, potentially leading to a reversal in the uptrend. Traders can use this pattern to make informed trading decisions, such as placing a short trade or exiting a long position.
It’s important to note that, like any other technical analysis tool, the tweezer top pattern should not be used in isolation. It is recommended to consider other factors, such as support and resistance levels, trend lines, and other candlestick patterns, to increase the probability of a successful trade.
The tweezer top pattern is a powerful candlestick formation that can signal a potential reversal in the Forex market. It consists of two consecutive candles with similar high prices, representing a failed attempt for the bulls to push the price higher. This pattern usually appears at the end of an uptrend and can provide valuable insights into the future direction of the market.
To interpret the tweezer top pattern, traders need to look for specific characteristics and take them into account when making trading decisions. Here are some key aspects to consider:
Read Also: What are the first 4 digits of an IBAN? | Explained in Detail
1. Two candles with similar high prices: The first candle in the pattern should have a high price, followed by a second candle with a similar or identical high price. This indicates that the bears are stepping in and preventing further upward movement.
2. Reversal signal: The tweezer top pattern is considered a bearish reversal signal. It suggests that the market sentiment is shifting from bullish to bearish, as the bulls fail to push the price higher and the bears start to take control.
Read Also: Can I Exchange Money at the Airport? Here's What You Need to Know
3. Volume: Volume analysis is crucial when interpreting the tweezer top pattern. An increase in volume during the formation of the pattern confirms the bearish sentiment and strengthens the reliability of the reversal signal.
4. Support and resistance levels: Traders should also consider the presence of key support and resistance levels near the tweezer top pattern. If the pattern forms near a strong resistance level, it adds further significance to the bearish reversal signal.
5. Confirmation: It is important to wait for confirmation before entering a trade based on the tweezer top pattern. Traders can look for additional bearish signals, such as a break below a support level or a bearish candlestick pattern, to strengthen the validity of the reversal signal.
6. Stop loss and take profit levels: When trading the tweezer top pattern, it is essential to set appropriate stop loss and take profit levels. Traders can place a stop loss above the high of the tweezer top pattern and set a take profit target based on their risk-reward ratio.

In conclusion, the tweezer top pattern is a reliable bearish reversal signal in Forex trading. Traders should carefully analyze the characteristics of the pattern, consider volume analysis and the presence of support and resistance levels, and wait for confirmation before entering a trade based on this pattern. By following these guidelines, traders can effectively interpret the tweezer top pattern and make informed trading decisions.
The Tweezer Top pattern is a bearish reversal pattern that consists of two or more candlesticks with the same high price level. It typically signifies a potential trend reversal from bullish to bearish.
To spot the Tweezer Top pattern, look for two or more candlesticks with the same high price level. The candlesticks should have small or no upper wicks and long lower wicks. The pattern is often found at the end of an uptrend and indicates a potential bearish reversal.
The Tweezer Top pattern signifies a potential trend reversal from bullish to bearish. It indicates that the buying pressure has weakened and the bears might take control of the market soon. Traders often look for this pattern as a signal to enter short positions or close their long positions.
The reliability of the Tweezer Top pattern depends on the context in which it appears. It is considered more reliable when it occurs after a strong uptrend and is accompanied by other bearish indicators or patterns. Traders should use additional technical analysis tools and indicators to confirm the validity of the pattern before making trading decisions.
There are several trading strategies that traders can use with the Tweezer Top pattern. One strategy is to enter a short position when the pattern is confirmed, placing a stop loss above the high of the highest candlestick in the pattern. Another strategy is to wait for a confirmation signal, such as a bearish candlestick pattern or a breakdown of a support level, before entering a short position.
The Tweezer Top pattern is a bearish reversal pattern that consists of two candlesticks with identical highs. The first candlestick is usually bullish, followed by a second bearish candlestick. This pattern suggests that the market may be nearing a top and could reverse its current uptrend.
To identify a Tweezer Top pattern, look for two candlesticks with equal or very close highs. The first candlestick should be bullish, indicating an uptrend, followed by a second bearish candlestick that opens at the same level as the previous candlestick’s high. This pattern often occurs at the top of an uptrend and can signal a potential reversal.

What is a reasonable compensation package? When considering a new job or negotiating a raise, one of the most important factors to consider is the …
Read Article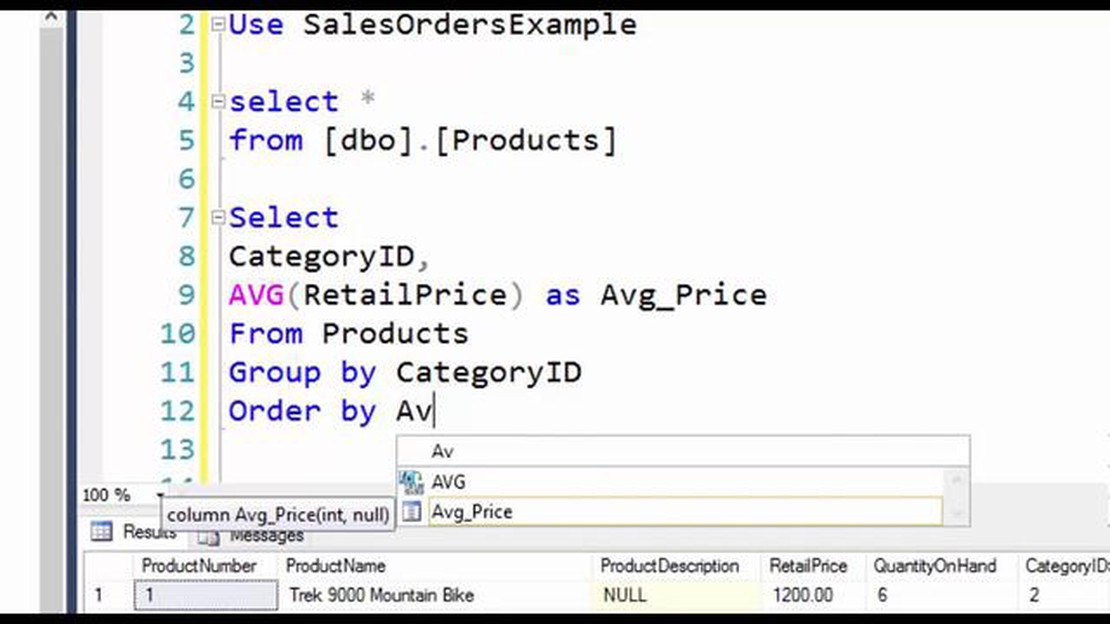
Understanding the AVG Function in TSQL TSQL, or Transact-SQL, is a specialized programming language used to manage and manipulate data in relational …
Read Article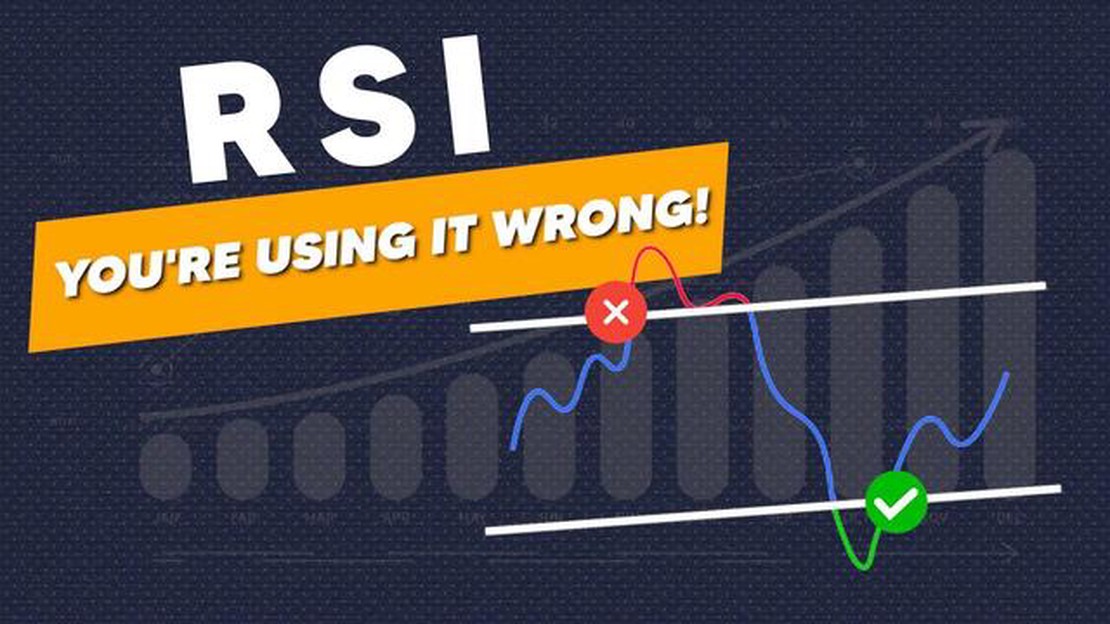
Understanding the 3 Period RSI Indicator The Relative Strength Index, or RSI, is a popular technical indicator used by traders to analyze market …
Read Article
4 Types of API: A Comprehensive Guide Application Programming Interfaces (APIs) play a crucial role in modern software development. They allow …
Read Article
What is the best programming language for automated trading? Automated trading has revolutionized the financial industry, allowing traders to execute …
Read Article
Is R better than Python for algo trading? When it comes to algorithmic trading, choosing the right programming language is crucial. Two of the most …
Read Article


