


QQQ Projections: What to Expect in the Future
Projection for QQQ QQQ, also known as the Invesco QQQ Trust, is an exchange-traded fund (ETF) that tracks the performance of the Nasdaq-100 Index. As …
Read Article
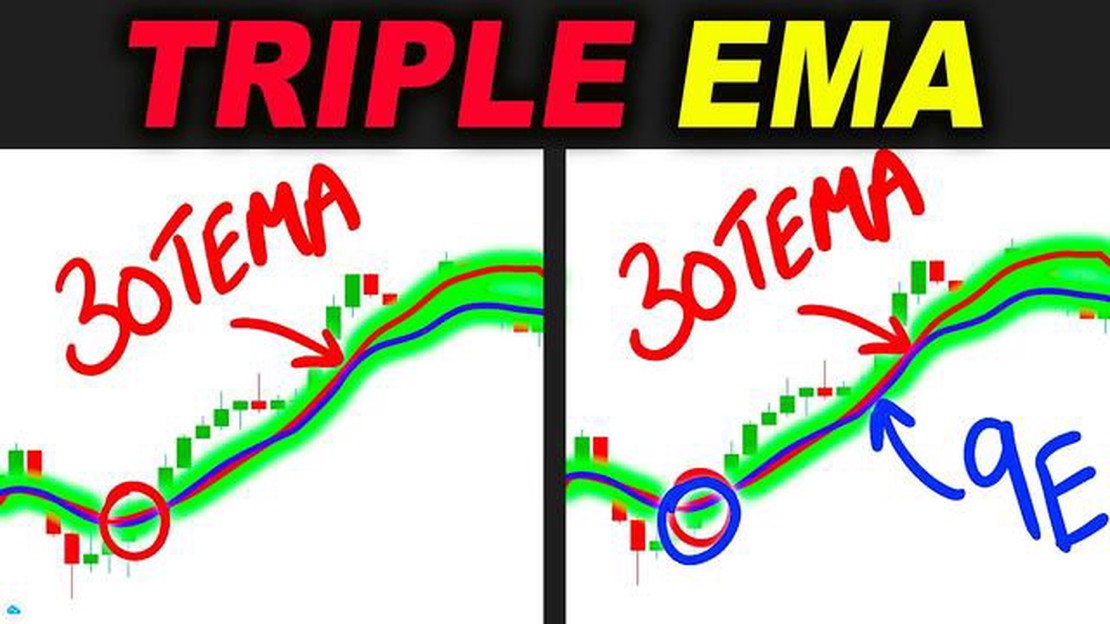
The triple moving average is a technical analysis tool that can greatly improve your trading strategy. It involves using three different moving averages to analyze stock price trends and make informed trading decisions. By considering short-term, medium-term, and long-term moving averages, traders can get a more comprehensive view of a stock’s price movements and potential future direction.
The first moving average in the triple moving average strategy is the short-term moving average. This is calculated by taking the average closing price of a stock over a short period of time, typically 10 to 20 days. It helps to identify short-term trends and reversals in the stock price. Traders often use the short-term moving average as an entry or exit signal for their trades.
The second moving average in the strategy is the medium-term moving average, which is calculated over a longer period, usually between 50 and 100 days. The medium-term moving average provides a smoother line that helps to filter out short-term noise and gives a clearer picture of the stock’s overall trend. It is often used as a confirmation signal when the short-term moving average crosses above or below the medium-term moving average.

The third and final moving average in the triple moving average strategy is the long-term moving average, calculated over a period of 200 days or more. This moving average represents the stock’s long-term trend and is often used as a benchmark to determine the overall direction of the stock. When the short-term and medium-term moving averages are above the long-term moving average, it is generally considered a bullish signal, indicating that the stock is in an uptrend. Conversely, when the short-term and medium-term moving averages are below the long-term moving average, it is considered a bearish signal, indicating a downtrend.
By combining these three moving averages and analyzing their crossovers and divergence, traders can gain valuable insights into a stock’s price movements and make more informed trading decisions. The triple moving average can help traders identify potential entry and exit points, as well as confirm the overall trend of a stock. It is a versatile tool that can be used in various timeframes and markets, making it a valuable addition to any trader’s toolkit.
In conclusion, the triple moving average is a powerful technical analysis tool that can enhance your trading strategy. By considering short-term, medium-term, and long-term moving averages, traders can gain a more comprehensive view of a stock’s price movements and make more informed decisions. Whether you are a novice trader or an experienced professional, incorporating the triple moving average into your strategy can greatly improve your trading results.
Read Also: How to buy Chinese renminbi (RMB) in India: A complete guide
The triple moving average is a technical analysis tool used to identify trends in the financial markets. It is a combination of three moving averages: a short-term moving average, an intermediate-term moving average, and a long-term moving average. By plotting these three averages on a price chart, traders can analyze the overall direction of the market and make informed trading decisions.
The short-term moving average is calculated by taking the average price of an asset over a short period of time, such as 10 days. This moving average reacts quickly to price changes and can help traders identify short-term trends. The intermediate-term moving average is calculated over a longer period, such as 50 days, and provides a more stable view of the market. Lastly, the long-term moving average is calculated over an even longer period, such as 200 days, and helps identify the long-term trend.
When the short-term moving average crosses above the intermediate-term moving average, it generates a buy signal, indicating that it may be a good time to enter a long position. Conversely, when the short-term moving average crosses below the intermediate-term moving average, it generates a sell signal, indicating that it may be a good time to exit a long position or even enter a short position.
The triple moving average can be used on any financial instrument, such as stocks, commodities, or currencies, and can be applied to any time frame, from intraday to monthly charts. It is a popular tool among technical analysts and can help improve trading strategies by providing a clear indication of market trends.
The Triple Moving Average (TMA) is a popular trading indicator that is used to analyze trends and predict future market movements. It is based on the concept of moving averages, which calculate the average price of an asset over a specific period of time. The TMA takes this concept a step further by using three different moving averages with varying lengths.
The three moving averages used in the TMA are typically referred to as the short-term, medium-term, and long-term moving averages. The short-term moving average is calculated using a shorter time period, such as 10 days, and is more sensitive to recent price movements. The medium-term moving average is calculated using a longer time period, such as 50 days, and provides a more balanced view of the market. The long-term moving average is calculated using the longest time period, such as 200 days, and helps to identify long-term trends.
By using multiple moving averages with different lengths, the TMA aims to capture both short-term and long-term trends in the market. When the short-term moving average crosses above the medium-term moving average, it is considered a bullish signal, indicating that the price is likely to continue rising. Conversely, when the short-term moving average crosses below the medium-term moving average, it is considered a bearish signal, indicating that the price is likely to continue falling.
In addition to the cross-overs between moving averages, traders also look for support and resistance levels. When the price moves above the long-term moving average, it is considered a bullish signal, while a move below the long-term moving average is considered a bearish signal. These support and resistance levels can help traders identify potential entry and exit points for their trades.
Read Also: Can You Day Trade for Free? Discover How to Trade without Paying Commissions
It is important to note that the TMA is not a standalone trading strategy, but rather a tool that can be used in conjunction with other technical analysis indicators and strategies. By understanding the dynamics of the TMA and how it interacts with other indicators, traders can gain a deeper insight into market trends and make more informed trading decisions.
The Triple Moving Average is a technical analysis tool that calculates the average price of an asset over a specific time period. It consists of three moving averages: a short-term moving average, a medium-term moving average, and a long-term moving average.
The Triple Moving Average can improve your trading strategy by providing clear buy and sell signals. When the short-term moving average crosses above the medium-term moving average and the medium-term moving average is above the long-term moving average, it indicates a buy signal. Conversely, when the short-term moving average crosses below the medium-term moving average and the medium-term moving average is below the long-term moving average, it indicates a sell signal.

Each moving average in the Triple Moving Average has its own significance. The short-term moving average reacts quickly to changes in price and helps identify short-term trends. The medium-term moving average provides a smoother representation of the overall trend. The long-term moving average helps identify the long-term trend and acts as a support or resistance level.
Yes, the Triple Moving Average can be used for any type of asset, including stocks, currencies, commodities, and cryptocurrencies. It is a versatile technical analysis tool that can be applied to different markets and timeframes.

Projection for QQQ QQQ, also known as the Invesco QQQ Trust, is an exchange-traded fund (ETF) that tracks the performance of the Nasdaq-100 Index. As …
Read Article
How to Make 5 Pips in Forex: A Winning Strategy Forex trading is a popular way to invest and make money in the financial markets. It involves buying …
Read Article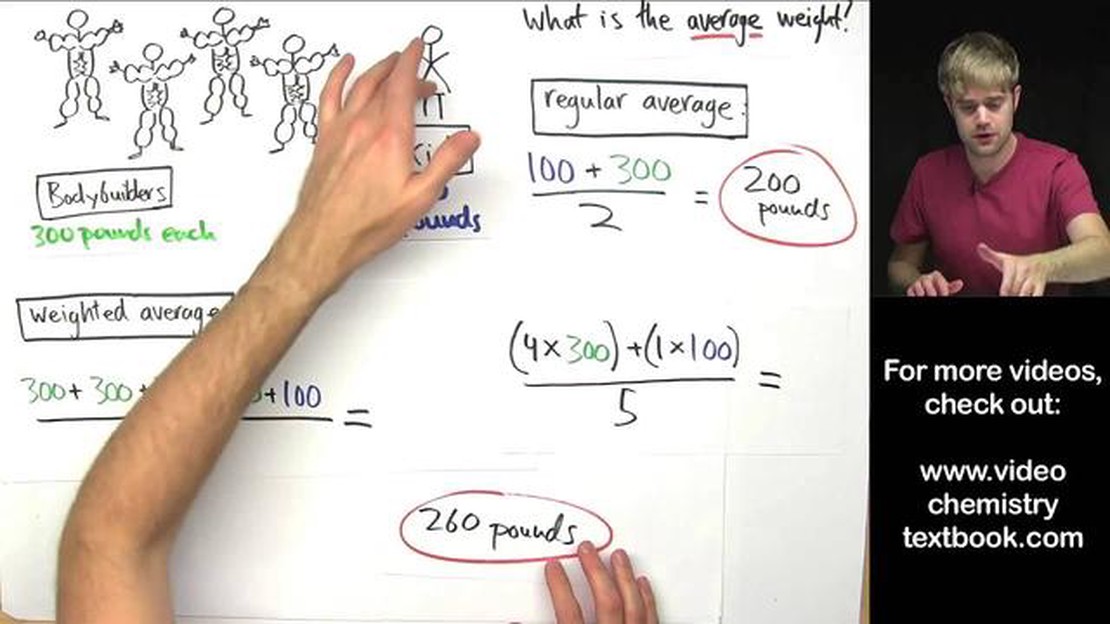
Why choose weighted average over average? When it comes to calculating averages, there are different methods to consider, such as the weighted average …
Read Article
Step-by-Step Guide to Starting a Forex Blog If you have a passion for Forex trading and want to share your knowledge with others, starting a Forex …
Read Article
Should I pay in MXN or USD? When traveling to Mexico, one of the common questions that arises is whether it is better to pay in Mexican Pesos (MXN) or …
Read Article
Can I trade options on eToro? When it comes to investing in the stock market, it’s important to have access to a platform that offers a wide range of …
Read Article


