


Is Insider Trading Considered a Stock Market Manipulation?
Is insider trading a stock? Insider trading is a practice that has sparked controversy and legal disputes for years. It occurs when individuals trade …
Read Article
In the field of finance, analyzing trends and patterns from data is crucial for making informed decisions. Moving averages are one of the most widely used tools in technical analysis to identify and predict market trends. By smoothing out fluctuations, moving averages provide a clearer picture of the overall direction of a stock’s price movement over a specific period of time.
So, what exactly is a moving average? A moving average is a calculation that helps determine the average price of a security over a certain number of periods, with each new data point replacing the oldest one. This calculation can be applied to various time frames, such as days, weeks, or months, depending on the desired level of detail.
Moving averages can be classified into two main types: simple moving averages (SMA) and exponential moving averages (EMA). While SMAs give equal weightage to all data points in the calculation, EMAs assign higher weightage to more recent data points. This difference in weighting makes EMAs more responsive to recent price changes, making them preferred by short-term traders.
Traders and investors use moving averages in various ways. One common strategy involves analyzing the crossover between two moving averages of different time periods. For example, a golden cross occurs when a shorter-term moving average, such as the 50-day SMA, crosses above a longer-term moving average, such as the 200-day SMA. This crossover is considered a bullish signal, indicating a potential trend reversal or a strong upward momentum.
Remember, moving averages are not standalone indicators but are used in conjunction with other technical tools to confirm market trends and potential trading opportunities. It is essential to develop a robust trading plan and combine moving averages with other indicators to increase the accuracy of your analysis.
A moving average is a commonly used statistical indicator that helps to identify trends in data. It is calculated by taking the average value of a set of data points over a specified time period, with the average “moving” as new data points are added and old data points are dropped.
Moving averages are used in various fields, including finance, economics, and technical analysis of stocks and other financial instruments. They are particularly useful for smoothing out short-term fluctuations in data and highlighting long-term trends.
There are different types of moving averages, including simple moving averages (SMA) and exponential moving averages (EMA). The SMA gives equal weight to each data point in the calculation, while the EMA gives more weight to the most recent data points.
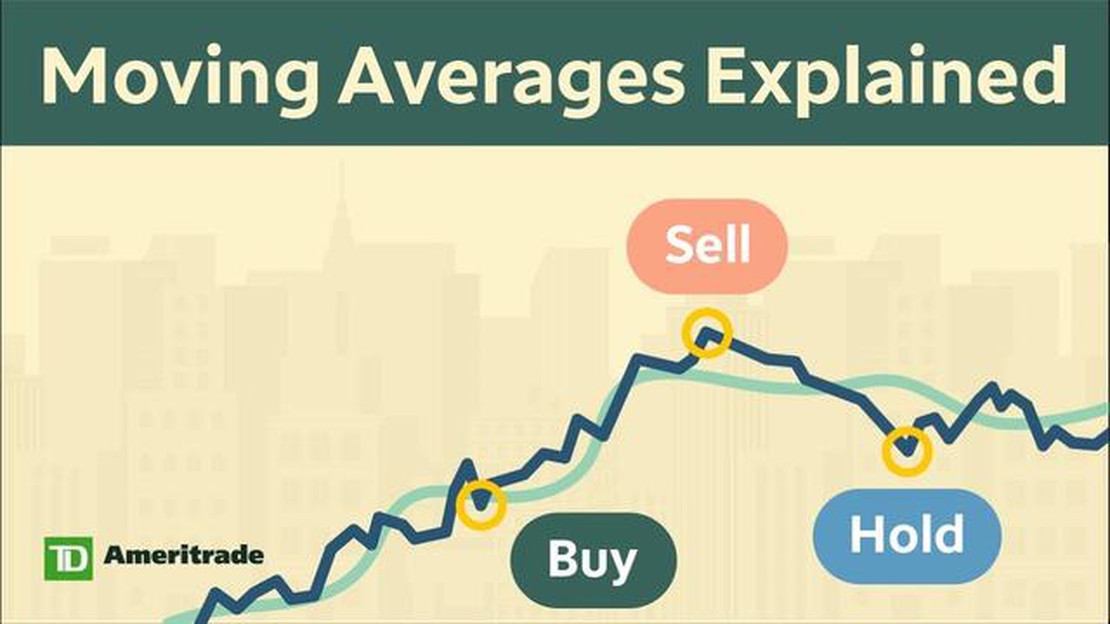
Moving averages can be plotted on a graph to visually represent the trend of the data. Traders and analysts use moving averages to help make decisions about buying and selling stocks or other assets. For example, if a stock’s price crosses above its 50-day moving average, it may be seen as a bullish signal, indicating that the stock is likely to continue rising.

Overall, moving averages provide a useful tool for understanding and interpreting data trends, and they can be a valuable addition to any data analysis or trading strategy.
There are several types of moving averages that traders and analysts commonly use to analyze financial data:
Simple Moving Average (SMA): The SMA is the simplest form of a moving average, and it is calculated by averaging the prices of a security over a specific period of time. Each data point has an equal weight in the calculation.
Read Also: Discover the 5 Essential Hand Signals for Safe Driving
Exponential Moving Average (EMA): The EMA is similar to the SMA, but it gives more weight to recent data points. This makes the EMA more responsive to recent price changes.
Weighted Moving Average (WMA): The WMA assigns different weights to different data points. The weights can be linear or exponential, and they determine the importance of each data point in the calculation.
Adaptive Moving Average (AMA): The AMA adjusts its parameters based on market conditions. It uses volatility to determine the length of the moving average, making it adaptive to changes in the market.
Smoothed Moving Average (SMMA): The SMMA is a variation of the simple moving average where more weight is given to recent data points. This helps to reduce the impact of noisy or erratic price movements.
Triangular Moving Average (TMA): The TMA is a weighted moving average that assigns more weight to data points in the middle of the calculation period. This creates a smoother line on the graph.
Volume Weighted Moving Average (VWMA): The VWMA is a moving average that takes into account the trading volume of a security. It gives more weight to periods with higher trading volume, reflecting the importance of those periods in the overall analysis.
Each type of moving average has its own advantages and disadvantages, and traders and analysts often use a combination of different moving averages to get a more comprehensive view of the market.
When it comes to analyzing data and trends on a graph, moving averages can be an incredibly useful tool. Here are some key benefits of using moving averages:
Read Also: Understanding the Basics of Moving Average Trading: A Comprehensive Guide
 4. Confirmation signals: Moving averages can provide confirmation signals for potential buy or sell decisions. For example, a crossover of a shorter-term moving average above a longer-term moving average may signal a bullish trend and present a buying opportunity.
5. Predictive power: Moving averages can help predict future price movements based on historical patterns and trends. Traders and investors often use moving averages as part of their technical analysis to forecast potential future price levels.
4. Confirmation signals: Moving averages can provide confirmation signals for potential buy or sell decisions. For example, a crossover of a shorter-term moving average above a longer-term moving average may signal a bullish trend and present a buying opportunity.
5. Predictive power: Moving averages can help predict future price movements based on historical patterns and trends. Traders and investors often use moving averages as part of their technical analysis to forecast potential future price levels.
In conclusion, moving averages offer a range of benefits when it comes to understanding and utilizing graphs. They can help smooth out data, identify trends, act as support/resistance levels, provide confirmation signals, and even have predictive power. Incorporating moving averages into your analysis can enhance your understanding of market trends and improve your decision-making process.
Moving averages help in understanding data trends by smoothing out fluctuations and highlighting overall patterns or trends in the data. They provide a clearer picture of the underlying trend by reducing short-term variations.
The simple moving average is calculated by taking the average of a set number of data points over a specified period of time, while the exponential moving average gives more weight to recent data points. This makes the exponential moving average more responsive to recent price changes.
Moving averages can be used to identify support and resistance levels by observing when the price of an asset crosses above or below a moving average. When the price crosses above a moving average, it may act as a support level, and when the price crosses below a moving average, it may act as a resistance level.
Yes, moving averages can be used to generate trading signals. For example, a crossover strategy can be employed where a short-term moving average crosses above or below a longer-term moving average. When the short-term moving average crosses above the long-term moving average, it may be a signal to buy, and when it crosses below, it may be a signal to sell.

Is insider trading a stock? Insider trading is a practice that has sparked controversy and legal disputes for years. It occurs when individuals trade …
Read Article
When Did Binary Options Start? Binary options, a type of financial instrument, have become increasingly popular over the years. But when were they …
Read Article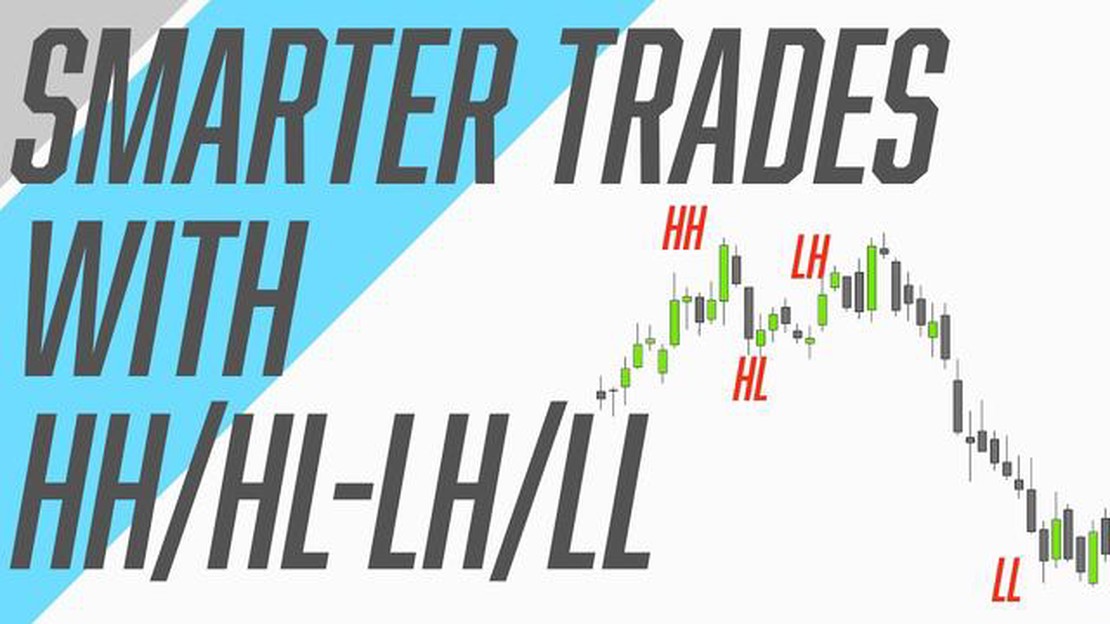
Understanding the HH HL Trading Strategy The world of trading can be a complex and risky one, with countless strategies and techniques available to …
Read Article
Current Swap Rate: What You Need to Know When it comes to the financial world, the term “swap rate” is often used. But what exactly does it mean? In …
Read Article
Reasons Behind the Depreciation of the AUD The Australian dollar (AUD) has experienced a significant drop in value over recent months, leading many to …
Read Article
Reasons behind the decreasing forex reserves in India India, one of the world’s largest economies, is facing a concerning trend in recent years - the …
Read Article


