


Discover the Best Strategy for Investing in FTSE | Expert Tips and Insights
Strategies for Investing in FTSE: Choosing the Best Approach Investing in the FTSE (Financial Times Stock Exchange) can be a lucrative endeavor for …
Read Article
When it comes to trading in the financial markets, understanding various technical indicators is crucial for making informed decisions. One popular and widely used indicator is the moving average. In this comprehensive guide, we will dive into the basics of moving averages and how they can be effectively used in trading strategies.
A moving average is a simple yet powerful tool that helps traders identify trends and potential price reversals. It calculates the average price of a security over a specific period of time, and plots it on a chart. The moving average smooths out price fluctuations, providing a clearer picture of the overall trend.
There are different types of moving averages, such as the simple moving average (SMA) and the exponential moving average (EMA). The SMA gives equal weight to all prices in the calculation, while the EMA places more weight on recent prices. Traders can choose which type of moving average to use based on their trading style and preferences.
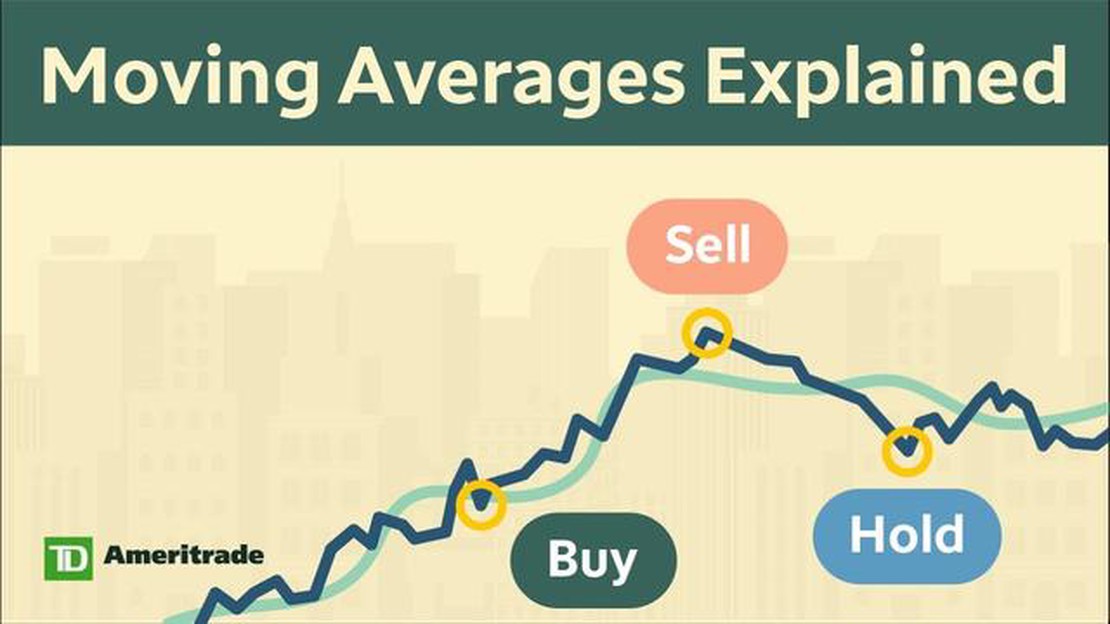
Moving averages can be used in various ways. One common application is to identify support and resistance levels. When the price of a security is trading above its moving average, it is considered a bullish signal and indicates that the uptrend is likely to continue. Conversely, when the price is trading below its moving average, it is a bearish signal and suggests that the downtrend may persist.
In addition to identifying trends, moving averages can also be used to generate buy and sell signals. A popular method is the crossover strategy, which involves the intersection of two moving averages of different time periods. For example, a buy signal is generated when the shorter-term moving average crosses above the longer-term moving average, indicating a potential upward reversal.
Overall, understanding the basics of moving average trading is essential for both novice and experienced traders. By using moving averages effectively, traders can gain valuable insights into market trends and make more informed trading decisions. In the following sections, we will explore different strategies and techniques for utilizing moving averages in your trading approach.
A moving average is a popular technical indicator used in trading and investing to analyze the price trend of an asset over a specific period of time. It is a common tool for trend following and is widely used by traders of all levels.
The moving average is calculated by taking the average closing prices of an asset over a certain number of periods. Some commonly used periods include 50, 100, and 200 days, but the choice of period depends on the trader’s strategy and trading style.

The moving average is called “moving” because it is constantly updated as new data becomes available. As each new period’s closing price is added to the calculation, the oldest price is dropped, creating a moving window of data.
The moving average smooths out the price data, helping to filter out short-term fluctuations and noise in the market. It provides a clearer picture of the overall price trend, making it easier to identify and follow the direction of the market.
Traders commonly use two types of moving averages: the simple moving average (SMA) and the exponential moving average (EMA). The SMA is calculated by taking the average of closing prices over a specific period, while the EMA gives more weight to recent prices, making it more sensitive to recent price movements.
Moving averages can be used in various ways. Many traders use them to identify the general direction of the market and to generate buy or sell signals when the price crosses above or below the moving average. Others use moving averages to determine support and resistance levels, as well as for identifying potential reversal points.
Read Also: Understanding the concept of leverage 1:1 in Forex trading
It is important to note that moving averages are lagging indicators, meaning they are based on past data and may not accurately predict future price movements. Therefore, they are often used in combination with other technical indicators and analysis tools to confirm signals and make more informed trading decisions.
Moving averages are widely used in technical analysis and can be a powerful tool for traders. They can help identify trends, determine support and resistance levels, and generate trade signals.
Read Also: How to Obtain Backtesting Data: A Step-by-Step Guide
One common use of moving averages is to determine the direction of a trend. Traders often use a combination of different moving averages, such as a short-term moving average and a long-term moving average, to identify the overall trend in a market. If the short-term moving average is above the long-term moving average, it can be a signal that the trend is bullish. Conversely, if the short-term moving average is below the long-term moving average, it can be a signal that the trend is bearish.
Moving averages can also be used to determine support and resistance levels. When the price of an asset approaches a moving average, it can act as a support or resistance level. If the price bounces off the moving average and continues in the same direction, it can be a signal that the support or resistance level has held. On the other hand, if the price breaks through the moving average, it can be a signal that the support or resistance level has been breached.
In addition to trend identification and support/resistance levels, moving averages can also generate trade signals. One popular trading strategy is the crossover strategy, which involves using two moving averages of different time periods. When the shorter-term moving average crosses above the longer-term moving average, it can be a signal to buy the asset. Conversely, when the shorter-term moving average crosses below the longer-term moving average, it can be a signal to sell the asset.
It’s important to note that moving averages are lagging indicators, meaning they are based on past price data. They can provide valuable insights into market trends, but they are not infallible and should be used in conjunction with other indicators and analysis techniques. Traders should also consider the timeframe they are trading on, as moving averages can produce different signals on different timeframes.

In conclusion, moving averages are a versatile trading indicator that can be used in a variety of ways. They can help identify trends, determine support and resistance levels, and generate trade signals. However, they should be used in conjunction with other analysis techniques and should be adjusted based on the timeframe being traded.
A moving average is a calculation used to analyze data points over a certain period of time to identify trends.
Moving average trading involves using moving averages to determine when to buy or sell a security based on price trends.
There are several types of moving averages, including simple moving average (SMA), exponential moving average (EMA), and weighted moving average (WMA).
The main difference between SMA and EMA is that SMA gives equal weight to all data points, while EMA gives more weight to recent data points.
Moving averages can be used to identify trends by plotting the average price over a certain period of time and analyzing its direction.
A moving average in trading is a technical indicator that averages out price data over a specified time period. It is used to identify trends and smooth out price fluctuations in order to make more informed trading decisions.

Strategies for Investing in FTSE: Choosing the Best Approach Investing in the FTSE (Financial Times Stock Exchange) can be a lucrative endeavor for …
Read Article
Minimum Computer Requirements for Forex Trading Forex trading, also known as foreign exchange trading, has become increasingly popular in recent …
Read Article
Trading Strategies: Is Focusing on a Single Pair the Best Approach? When it comes to forex trading, one question that often arises is whether it is …
Read Article
Should I buy options on Friday? Options trading can be an exciting and lucrative venture for those who understand the risks and rewards involved. …
Read Article
How to Write Options in Ibkr Options trading can be a lucrative investment strategy, but it’s important to understand the mechanics of writing options …
Read Article
Swing Trading Strategies for Weekly Options Swing trading is a popular strategy among options traders, as it allows for short-term trades that …
Read Article


