


Understanding the Moving Minimum in Simulink and Its Applications
Understanding the Moving Minimum in Simulink Simulink is a powerful simulation and modeling tool widely used in various fields including engineering, …
Read Article
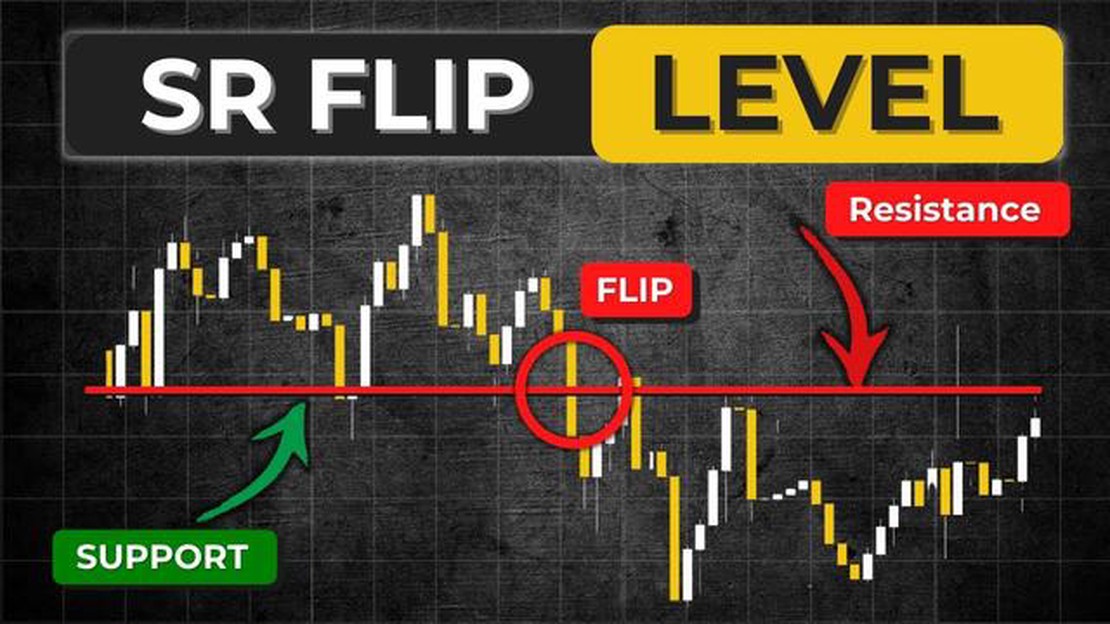
If you’re a trader or investor, understanding price action is crucial to making informed decisions in the market. One popular price action pattern that traders often look out for is the SR flip, also known as support and resistance flip.
The SR flip is a powerful price action pattern that occurs when a level of support becomes a level of resistance, or vice versa. It represents a shift in market sentiment and can signal potential reversals or continuations in price movements. Traders look for these flips to identify key levels where price might react.
Support and resistance levels are areas on a price chart where buying or selling pressure is expected to be strong. When a previous support level is broken, it often turns into a resistance level as traders who missed the initial move look to sell at that level. Conversely, when a previous resistance level is broken, it becomes a support level as traders buy at that level to push price higher.
The SR flip pattern can be seen across various time frames and in different markets. It can be spotted using technical analysis tools such as trend lines, moving averages, or price patterns. Traders often use additional confirmation signals, such as candlestick patterns or volume analysis, to increase the reliability of the SR flip pattern.
In this comprehensive guide, we will delve deeper into the SR flip price action pattern, exploring its characteristics, how to identify it, and how to incorporate it into your trading strategy. Understanding this pattern will provide you with a valuable tool to navigate the markets with more confidence and precision.
The SR Flip Price Action is a commonly used trading term that refers to a specific price behavior pattern on a price chart. SR stands for Support and Resistance, which are two key levels that traders use to identify potential areas of buying or selling interest in the market. The term “flip” refers to a change in the role of these support and resistance levels.
When the price of an asset breaks above a resistance level, it is said to flip and become a new support level. Conversely, when the price breaks below a support level, it flips and becomes a new resistance level. This flipping of support and resistance levels creates opportunities for traders to enter or exit trades based on the potential for price reversals or continuations.
Traders often look for confirmation of the SR flip price action through factors such as volume, candlestick patterns, or other technical indicators. These confirmations help verify that the price action is indeed a significant flip in the market structure and not a false breakout or a temporary price fluctuation.
By understanding and recognizing SR flip price action, traders can anticipate potential areas of market reversal or continuation. This knowledge can be used to identify high-probability trade setups and manage risk effectively. Traders can incorporate this price action pattern into their trading strategies or use it as a standalone method to make more informed trading decisions.
Overall, the SR flip price action is a valuable tool for traders to identify key levels of support and resistance and to anticipate potential changes in market direction. It helps traders spot potential trading opportunities and make more informed decisions based on market dynamics and price behavior.
In price action trading, support and resistance (SR) levels play a crucial role in analyzing market trends and making trading decisions. The concept of SR flip refers to a situation where a support level becomes a resistance level, or vice versa.

When a price breaks above a strong resistance level, it indicates a bullish sentiment and suggests that the buying pressure has overcome the selling pressure. This breakout can lead to a significant price increase as more traders enter the market, hoping to capitalize on the upward movement.
Conversely, when a price falls below a strong support level, it indicates a bearish sentiment and suggests that the selling pressure has overcome the buying pressure. This breakdown can lead to a significant price decrease as more traders enter the market, hoping to profit from the downward movement.
The significance of the SR flip lies in its ability to provide valuable insights into market dynamics. Traders who can identify and anticipate SR flips can make informed decisions about entering or exiting trades, setting profit targets, and placing stop-loss orders.
Additionally, SR flips can be used to identify potential trend reversals. If a previously strong resistance level becomes a support level after a breakout, it suggests a shift from bearish to bullish sentiment. Conversely, if a previously strong support level becomes a resistance level after a breakdown, it suggests a shift from bullish to bearish sentiment.
To identify SR flips, traders typically use technical analysis tools such as trendlines, horizontal support and resistance levels, and candlestick patterns. By combining these tools with an understanding of price action and market psychology, traders can increase their chances of success in the market.
In conclusion, the concept of SR flip is a powerful tool in price action trading. By understanding and analyzing support and resistance levels, traders can gain valuable insights into market trends and make informed trading decisions. Whether identifying breakout opportunities or anticipating trend reversals, the significance of SR flips cannot be underestimated in the world of price action trading.
Read Also: Understanding Margin Requirements for Level 3 Options Trading
1. Support and Resistance Levels: SR flip price action is characterized by the frequent testing of support and resistance levels on a price chart. These levels represent areas where buyers and sellers converge, creating a battleground for market participants.
2. Breakouts: SR flip price action often involves breakouts, where price moves beyond a key support or resistance level. Breakouts can indicate a shift in market sentiment and can lead to significant price movements.
Read Also: 6 Reasons Why a CEO Would Buy His Own Stock
3. Role Reversal: A key characteristic of SR flip price action is the concept of role reversal. This occurs when a former resistance level becomes a new support level or vice versa. Role reversal adds depth and credibility to support and resistance levels.
4. False Breakouts: SR flip price action can also result in false breakouts, where price temporarily breaks a support or resistance level but quickly reverses back within the range. False breakouts can trap traders and create opportunities for others to enter the market.
5. Volume Confirmation: Volume plays a crucial role in SR flip price action. Increasing volume during a breakout or a bounce off a support or resistance level can provide confirmation of market strength and direction.
6. Trend Identification: SR flip price action can help identify trends in the market. An uptrend is characterized by higher swing highs and higher swing lows, while a downtrend is characterized by lower swing highs and lower swing lows.
7. Chart Patterns: SR flip price action can be accompanied by various chart patterns such as double tops, double bottoms, head and shoulders, and triangles. These patterns can provide additional confirmation of price reversals at key support and resistance levels.
8. Timeframes: SR flip price action can be observed on different timeframes, from short-term intraday charts to longer-term daily or weekly charts. Traders can choose the timeframe that suits their trading style and preferences.

9. Risk Management: Understanding the key characteristics of SR flip price action can help traders in their risk management strategies. Setting appropriate stop-loss levels and considering risk-reward ratios are essential to successful trading.
10. Patience and Practice: Mastering SR flip price action requires patience, practice, and experience. Traders should devote time to studying charts, analyzing price movements, and understanding the dynamics of support and resistance levels.
Overall, SR flip price action provides traders with valuable insights into market dynamics and can be a powerful tool in their trading arsenal.
The SR Flip price action is a technical analysis pattern that occurs when a support level becomes a resistance level, or vice versa.
To identify an SR Flip price action, you need to look for a level that was previously acting as support or resistance, and then observe if it flips roles and starts acting as the opposite.
The SR Flip price action is significant because it signifies a potential change in market sentiment. It suggests that buyers or sellers have gained enough strength to push the price beyond a previous support or resistance level, indicating a possible trend reversal or continuation.
To trade the SR Flip price action, you can wait for confirmation of the flip by looking for price to break and close above or below the level, depending on the direction of the flip. You can also combine it with other technical indicators or patterns to increase the probability of a successful trade.
Like any trading strategy, there are risks associated with trading the SR Flip price action. False breakouts and fake flips can occur, resulting in losses. It’s important to use proper risk management techniques and always consider other factors such as market conditions and overall trend before making trading decisions.
An SR flip in price action refers to a reversal of a support level (S) into a resistance level (R), or vice versa. This occurs when the price breaks through a support level and starts to move upwards, effectively turning the previous support level into a new resistance level.

Understanding the Moving Minimum in Simulink Simulink is a powerful simulation and modeling tool widely used in various fields including engineering, …
Read Article
Is Ma and MACD the same? Traders and investors often use technical indicators to analyze financial markets and make informed decisions about when to …
Read Article
Brokerage for Options Trading in Sharekhan Sharekhan is one of the leading brokerage firms in India that offers various trading services, including …
Read Article
Who is the CEO of ThinkMarkets? When it comes to the success of a company, strong leadership is crucial. One such leader is the CEO of ThinkMarkets, a …
Read Article
Best strategy for trading Forex Foreign exchange trading, also known as Forex trading, can be a profitable venture for those who have the expertise …
Read Article
Is It Possible to Lose Money in Copy Trading? Copy trading, also known as mirror trading or social trading, has gained popularity in recent years as a …
Read Article


