


Trading Hours of CBOE: Everything You Need to Know
A Comprehensive Guide to CBOE Trading Hours: What You Should Know The Chicago Board Options Exchange (CBOE) is one of the largest options exchanges in …
Read Article
The simple moving average (SMA) is a widely used technical analysis tool that helps traders and investors make informed decisions in the financial markets. It is a mathematical calculation that provides a smoothed line of the average price over a specified period of time. By analyzing this line, traders can gain insights into the overall trend and potential future price movements.
The SMA is calculated by adding up the closing prices of a financial instrument over a specific number of periods and dividing the result by the number of periods. For example, a 20-day SMA would add up the closing prices of the last 20 days and divide it by 20. This calculation is repeated for each period, resulting in a line that represents the average price over the specified time frame.
Traders often use the SMA to identify trends and determine potential entry and exit points for their trades. When the price is above the SMA, it is generally considered a bullish signal, indicating that the trend is upward. Conversely, when the price is below the SMA, it is considered a bearish signal, suggesting that the trend is downward. By analyzing the relationship between the price and the SMA, traders can make better-informed decisions and potentially profit from market movements.
It is important to note that the SMA is a lagging indicator, meaning it is based on past price data. It is not designed to predict future price movements with certainty, but rather to provide a visual representation of the overall trend. Traders often use other technical indicators in conjunction with the SMA to confirm signals and increase the accuracy of their analysis.
In conclusion, the simple moving average is a powerful tool for traders and investors looking to analyze market trends and make informed decisions. By understanding how it is calculated and interpreting its relationship to price movement, traders can gain valuable insights and potentially improve their trading performance.
The Simple Moving Average (SMA) is a widely used technical indicator that helps traders and investors analyze historical price trends and make informed decisions about buying or selling securities. It is a straightforward calculation used to smooth out price data over a specified period. In this comprehensive overview, we will delve into the fundamentals of the Simple Moving Average and explore its application in the financial markets.

At its core, the Simple Moving Average is a mathematical calculation that takes the average of a set number of previous closing prices. By averaging out the prices over a given period, the SMA reveals a smoothed line that can help identify trends, support, and resistance levels. It is essential to note that the SMA is a lagging indicator because it is based on past prices, making it useful for confirming trends rather than predicting future price movements.
Traders commonly use different timeframes when calculating the Simple Moving Average, depending on their trading strategies and objectives. Short-term traders may use shorter periods, such as 10 or 20 days, to capture more immediate price movements. Long-term investors, on the other hand, may use longer periods, such as 50 or 200 days, to identify long-term trends.
There are two main types of Simple Moving Averages: the Simple Moving Average (SMA) and the Exponential Moving Average (EMA). While both indicators have the same goal of smoothing out price data, they differ in terms of their calculation methods. The SMA assigns an equal weight to each data point in the calculated period, whereas the EMA puts more weight on recent prices, resulting in a faster response to price changes.
Read Also: Find the Best Stock Watchlist App for Your Needs | Expert Reviews
One of the primary uses of the Simple Moving Average is to identify support and resistance levels. When the price moves above the SMA, it is often considered a bullish signal, indicating potential buying opportunities. Conversely, when the price falls below the SMA, it may signify a bearish signal, suggesting potential selling opportunities.
The Simple Moving Average can also be used to generate trading signals when different moving averages cross each other. For example, when a shorter-term moving average, such as a 50-day SMA, crosses above a longer-term moving average, such as a 200-day SMA, it is often seen as a buy signal. On the other hand, when the shorter-term moving average crosses below the longer-term moving average, it may be a sell signal.
In conclusion, the Simple Moving Average is a versatile technical indicator that provides valuable insights into price trends and potential trading opportunities. By understanding its calculation method, timeframe selection, and interpretation of signals, traders and investors can effectively incorporate the SMA into their decision-making process. However, like any technical indicator, the Simple Moving Average should not be used in isolation but rather in conjunction with other fundamental and technical analysis tools to enhance its effectiveness.
The simple moving average (SMA) is a widely used technical analysis tool that helps traders identify trends and potential reversals in a stock’s price. It is a lagging indicator that smoothens out price data over a specific time period, allowing traders to better understand the overall direction of the market.
The SMA is calculated by adding up a set number of prices over a given time period and then dividing that sum by the number of prices. For example, a 20-day SMA would add up the closing prices of the last 20 days and divide that sum by 20.
The SMA is plotted on a chart as a line that connects the average price points over the specified time period, creating a visual representation of the stock’s price movement over time.
Read Also: Today's India's Foreign Reserves: Current Figures and Analysis
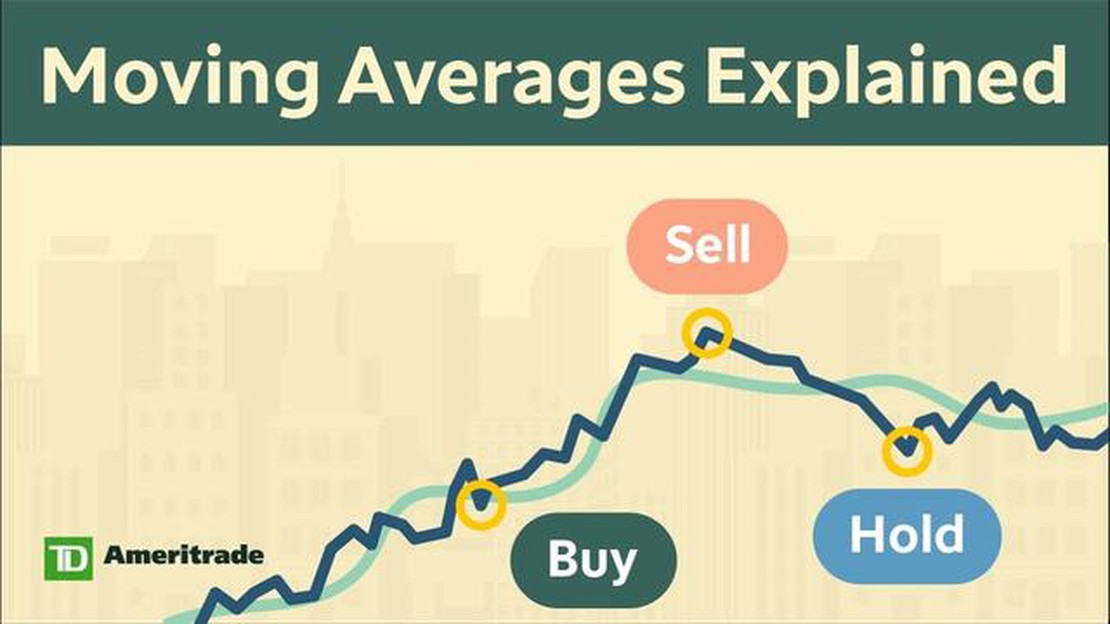
Traders use the SMA to identify key support and resistance levels. When the price is above the SMA, it indicates an uptrend, while a price below the SMA suggests a downtrend. The SMA can also be used to generate buy and sell signals, with traders looking for crossovers between the SMA and the price line as potential entry or exit points.
One of the advantages of using the SMA is its simplicity. It is easy to calculate and understand, making it accessible for beginner traders. However, it does have limitations, such as its susceptibility to lag and its inability to account for sudden price spikes or gaps.
In conclusion, the SMA is a basic yet powerful tool in technical analysis. By smoothing out price data and identifying trends, it provides traders with valuable insights into the overall direction of the market. Understanding the basics of the SMA is essential for any trader looking to incorporate technical analysis into their trading strategy.

A simple moving average (SMA) is a technical analysis tool that is used to identify trends and analyze the strength of a security’s price.
A simple moving average is calculated by adding up a specified number of data points and dividing the sum by that number.
The simple moving average is significant because it helps traders and investors identify trend reversals, support and resistance levels, and potential entry and exit points.
The simple moving average is not designed to predict future price movements. Instead, it is used to provide a smoothed representation of the price data and aid in trend identification.

A Comprehensive Guide to CBOE Trading Hours: What You Should Know The Chicago Board Options Exchange (CBOE) is one of the largest options exchanges in …
Read Article
Summary of the Art of Living Living a fulfilling life is a pursuit that has captivated thinkers, philosophers, and individuals from all walks of life …
Read Article
What is the amount of Nigeria’s foreign reserve? The foreign exchange reserve of Nigeria is an important indicator of the country’s economic health …
Read Article
Parent Company of Forex: Exploring the Dominant Players in the Foreign Exchange Market The Forex market is a global decentralized marketplace where …
Read Article
Understanding the Meaning of MMR: Explained MMR stands for “Matchmaking Rating” which is a measurement used in online gaming to determine a player’s …
Read Article
How to Make Profit with a Limit Order When it comes to trading in the financial markets, one of the most important tools in a trader’s arsenal is the …
Read Article


